





DAX analysis: Has the German index risen too far, too fast?
With the US out for a holiday, the focus remains firmly on European markets today, where stocks have been surging lately thanks to Trump pushing for a swift resolution to the Ukraine war. But have the markets got ahead of themselves with all this optimism? This DAX analysis shows the German index is now at extremely overbought levels, which calls for caution.
Share this:

Sentiment in Europe remained positive as the major stock indices extended their recent gains, with the DAX hitting yet another record high to become even more technically overbought. The gains were led by shares in defence companies on the likelihood of greater military spending in the EU, which could force governments to raise borrowing in the coming years. Hence, bond prices fell as yields on German, French, and Italian bonds climbed noticeably. With the US out for a holiday, the focus remains firmly on European markets today, where stocks have been surging lately thanks to Trump pushing for a swift resolution to the Ukraine war. But have the markets got ahead of themselves with all this optimism? This DAX analysis shows the German index is now at extremely overbought levels, which calls for caution.
Technical DAX analysis: weekly chart
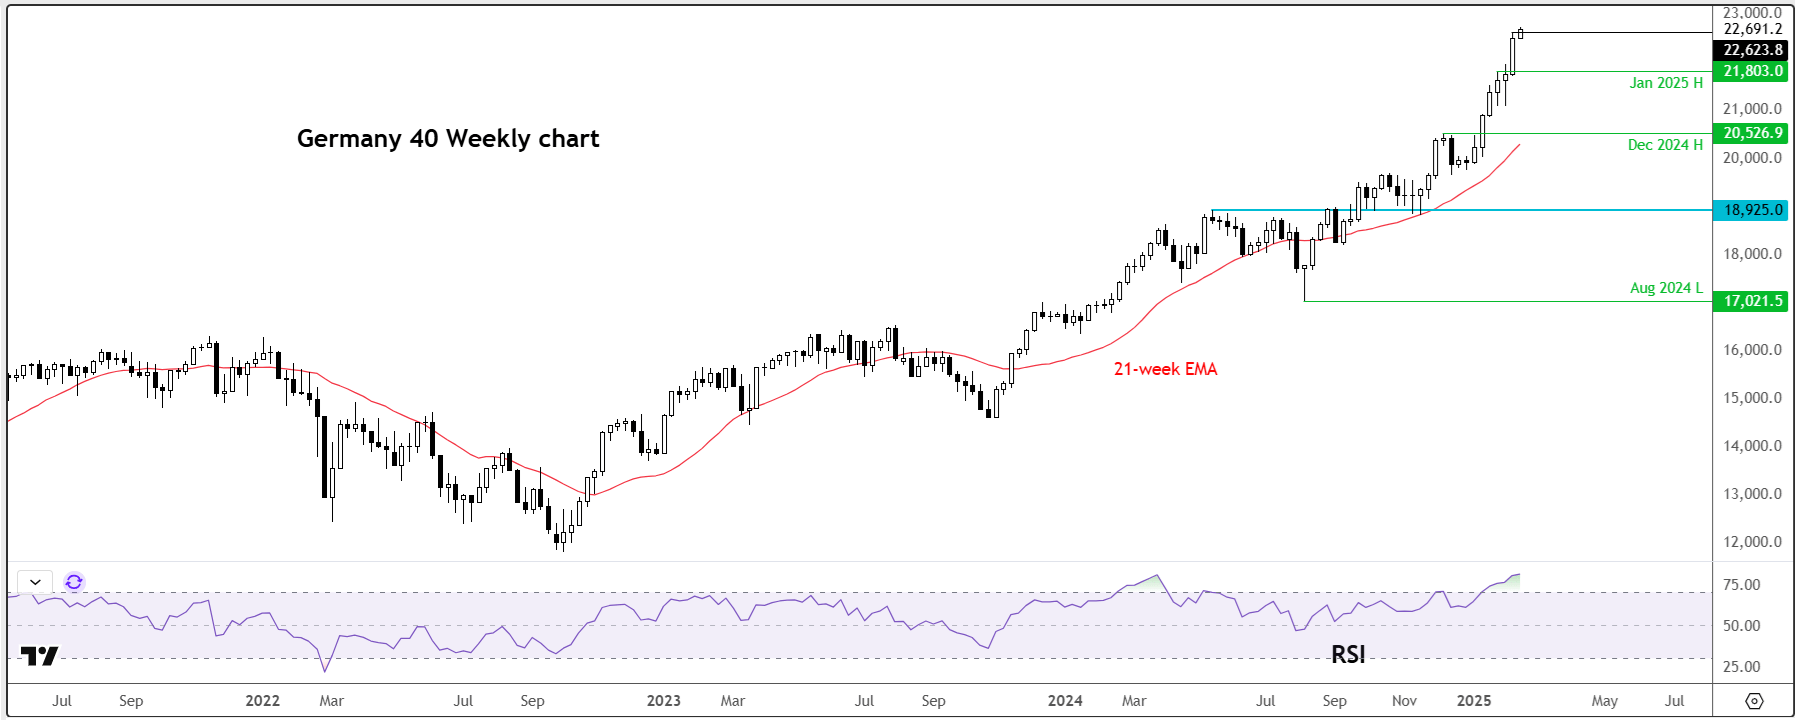
For now, the DAX remains in an impressive long-term uptrend. The Germany index bottomed in October 2022, and it has since only had two serious corrections in the pursuing years, both of which only shaved off 10% before dip buyers stepped in to drive the market to new all-time highs. All other pullbacks haven been quite shallow of around 5-7 percent. As a result, the DAX has remained mostly above the short-term 21-week moving average. Price action has been very impressive indeed.
However, as the index has now reached long-term overbought levels, there is a risk now that we could see a long overdue correction in the days or week ahead. The Relative Strength Index (RSI) is at severely overbought level of 80+ (81.3) n the weekly time frame. The last time the index was this overbought was back in March last year when the RSI reached 81.0 before easing back down. The index went on to hit a new high in May of that year before dropping 10% until the markets bottomed in August.
If history repeats itself and we do see a correction, a 10% drop could send the index back to the levels it was trading at the end of December of around 20500, where the 21-week exponential average would come into play.
Given the market has repeatedly respected this moving average, we could then see the resumption of the bullish trend again there, unless some major bearish catalyst emerges to cause a more severe correction. But our bearish scenario base case is only a 10 or so percent correction – if it happens.
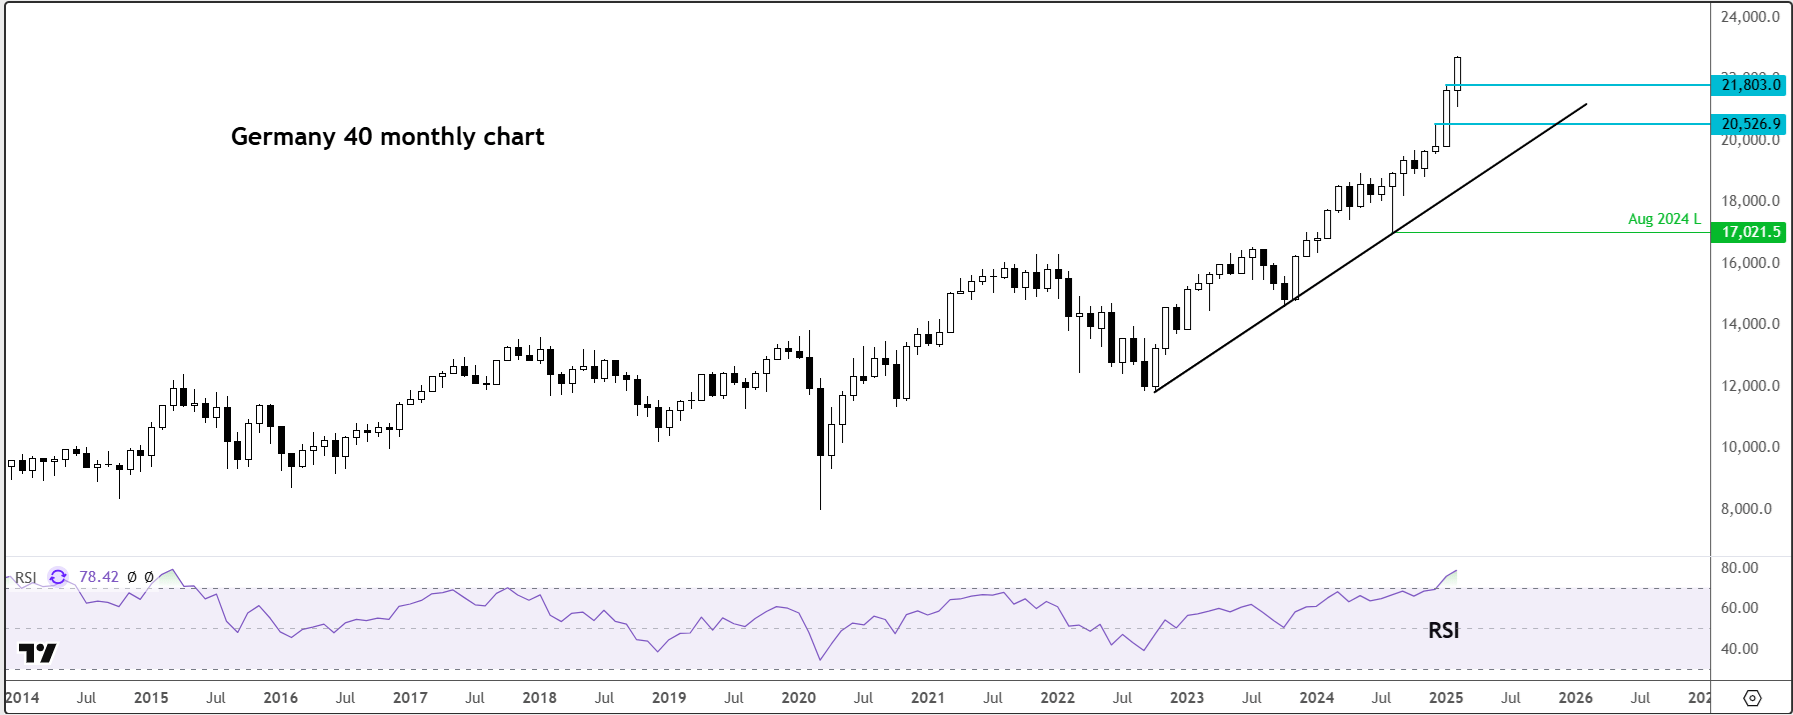
Monthly RSI is nearly at 80 – a rare occurrence
On the monthly chart, the DAX is now on its 4th monthly gains, and up in the last 7 out of the past 8 months. Unsurprisingly, the RSI on this time frame has surged to extreme levels, too – nearly at 80 (79.0). The last time the index was this overbought was back in March 2015 – nearly a decade ago! Then, the DAX topped in early April, before slumping some 30% in the pursuing months, until bottoming in February 2016.
DAX analysis: Key levels to watch on daily chart
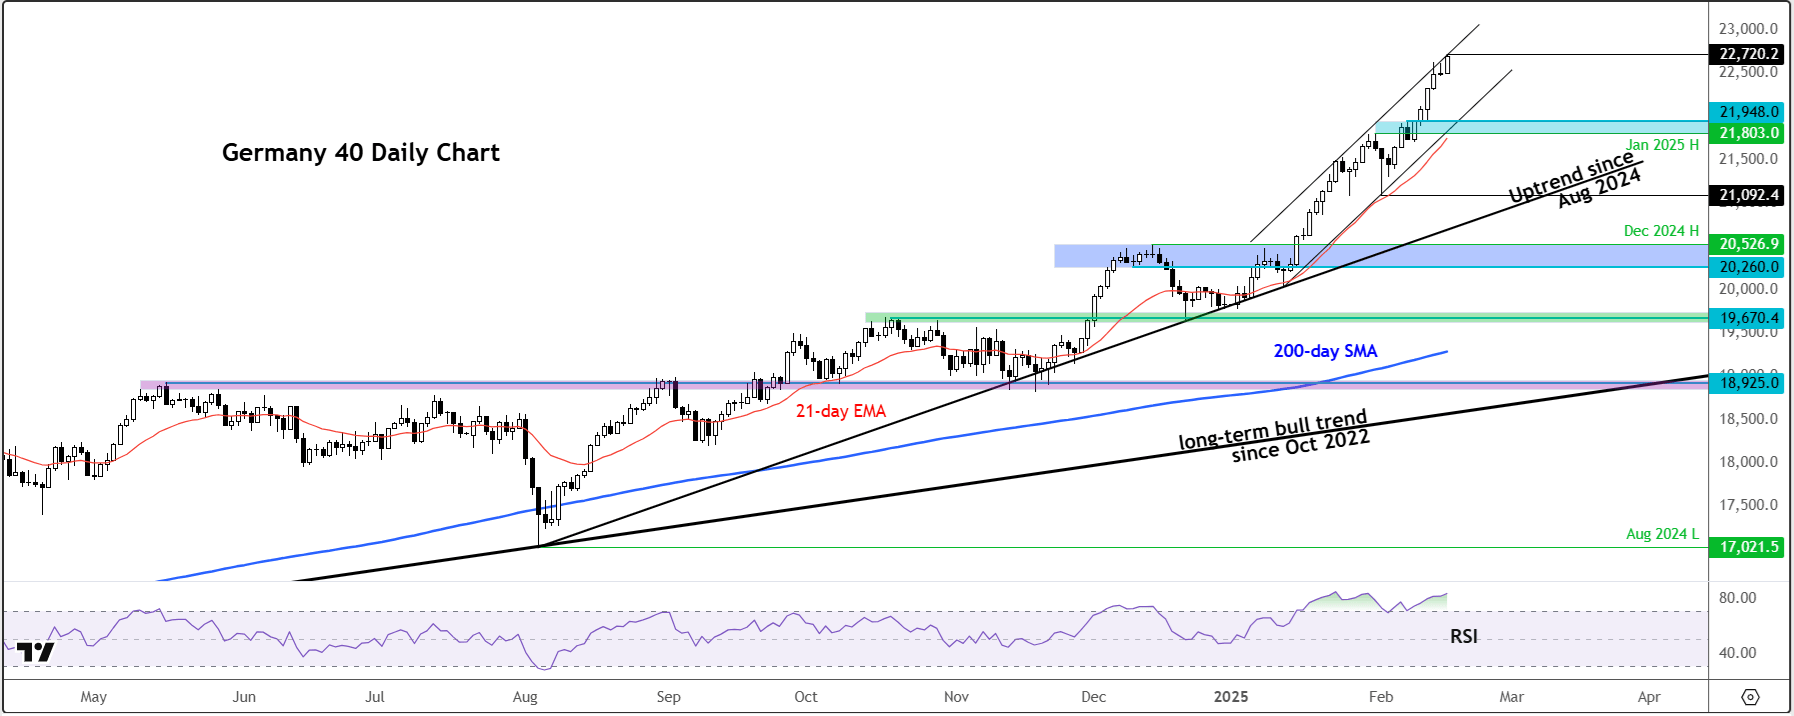
On the daily time frame, the DAX was testing the top of its bullish channel and a new all-time high between 22720 to 22800. The RSI was at 83, slightly below the January levels of 84-85. In other words, the RSI was in a state of negative divergence on this time frame. Put another way, the RSI has made a lower high at overbought levels of above 70.00, when the underlying DAX index made new all-time highs. This divergence suggests that the strong momentum could be losing steam.
A correction is needed to move the RSI back to neutral-to-oversold levels again.
The bears will need to break down some key support levels to make a serious dent in this rally. Short-term support now comes in around the 22500 area. Then, there is nothing significant seen until the support trend of the bullish channel around 21950. Below that area, January’s high of 21803 will come into focus, where the 21-day exponential average also converges.
Only if and when we see the breakdown of the abovementioned support levels, will things look and feel interesting. The bears must await a clear reversal signal given how strong markets have been last year, despite all the doom and gloom out there.
Source for all charts used in this article: TradingView.com
-- Written by Fawad Razaqzada, Market Analyst
Follow Fawad on Twitter @Trader_F_R
How to trade with City Index
You can trade with City Index by following these four easy steps:
- Open an account, or log in if you’re already a customer
• Open an account in the UK
• Open an account in Australia
• Open an account in Singapore
- Search for the company you want to trade in our award-winning platform
- Choose your position and size, and your stop and limit levels
- Place the trade
Related tags:



The complete CFD trading experience
Award-winning platforms, competitive spreads, low commissions and dedicated support.
We live and breathe the markets and are dedicated to helping traders realise their ambitions as we continue to set the industry bar.
Economic calendar
Web Trader platform
Our sophisticated web-based platform is packed with features.
Related articles
Nikkei breakout accelerates as yen weakness returns
Nikkei has started October with a powerful breakout, helped by renewed yen weakness and strong upside momentum

S&P 500 Forecast: SPX Continues to Drift Away from Record Highs
Recent trading sessions have done little to restore confidence in the equity market. Over the last four sessions, the S&P 500 has declined by nearly 1.00%, a move that highlights growing short-term weakness and keeps the index moving further away from its record-high territory.


The RBA Hiked Rates and the Australian Dollar Still Fell
AUD/USD fell after the RBA rate hike because the central bank's hawkish stance was already priced in while the U.S. dollar stayed firm.
StoneX Europe Ltd may make third party material available on this website which may contain information included but not limited to the conditions of financial markets. The material is for information purposes only and does not contain, and should not be construed as containing, investment advice and/or investment recommendation and/or an investment research and/or an offer of or solicitation for any transactions in financial instruments; any decision to enter into a specific transaction shall be made by the client following an assessment by him/her of their situation.
StoneX Europe Ltd makes no representation or warranty and assumes no liability as to the accuracy or completeness of the information provided, nor any loss arising from any investment based on a recommendation, forecast or other information supplied. You should always seek independent advice as to your suitability to speculate in any related markets and your ability to assume the associated risks, if you are at all unsure. We are not under any obligation to update any such material. Any opinion made may be personal to the author and may not reflect the opinion of StoneX Europe Ltd.