





Does inflation matter right now USDJPY US 10 Year Yields
The technicals point to a possible lower move in yields and USD/JPY in the short-term, regardless of the outcome
Share this:

Recall last month when the US released CPI for May and the print was 5% YoY. The markets didn’t know what to think: expectations were already extremely high at 4.7% YoY, and 5% was over the top. Inflation was here to stay! That was on June 10th and 10-year yields were trading at 1.53%. At time, the Fed was arguing that inflation was transitory. But at the Fed’s June FOMC meeting a week later, the dot-plots caught traders off-guard as the Fed seemed to agree that tapering may need to begin sooner than later. Inflation at 5% is much higher than the Fed’s targeted rate of 2%. 10-year yields are currently at 1.366%. USD/JPY, which trades similar to US yields, closed June 10th at 109.31.
On July 13th, the US will release CPI for June. Expectations are for 4.9% YoY. Since the last Fed meeting, speakers have been mixed with some calling for tapering sooner than later. June’s Non-Farm Payroll number was strong, with 850,000 jobs added to the economy. However, last week, bonds moved higher while yields and USD/JPY moved lower. 10-year yields moved from 1.447% down to 1.25% before profit taking ensued on Friday. This was the lowest level for yields since mid-February! USD/JPY sold off from a high of 111.19 on the NFP release down to 109.53 on Thursday, before recovering on Friday. So, after a strong NFP print, yields and USD/JPY fell. This is exactly the opposite of what one may have expected if the Fed was going to begin tapering.
There are a few reasons this may have happened:
- Traders may have been positioned for a stronger print (short bonds and long USD/JPY). Those short bonds were squeezed, and those long USD/JPY were forced to take profits. Therefore, position squaring may have followed the NFP print.
- The unemployment rate upticked from 5.7% to 5.9%. Traders may have been looking at this number rather than the headline number.
- Traders ran for safe-haven bonds and Yen as the Delta variant makes its rounds.
- Traders may have been began looking ahead to the CPI data this week. A 4.9% YoY headline expectation 2 months in a row seems quite strong (How high can the price of used cars go?)
- Traders may have begun to believe that inflation truly is transitory. Was the Fed right after all?
- It’s technical:
US 10 Year Yields had already retraced 50% on the November 2018 highs to the March 2020 lows on March 29th. As the pullback in yields began (a majority of which occurred last week), it held a few bps above horizontal support and the 38.2% Fibonacci retracement level from the March 2020 lows to the March 29th highs near 1.250%.
Source: Tradingview, City Index
On a 240-minute timeframe the move off the lows on Friday appears that it may be corrective, as yields formed a pennant pattern. If 10-year yields break back below 1.343% (the bottom of the pennant), they could target 1.149%, which wouldn’t do any damage to the longer-term technical picture (see daily chart). However, yields first must break the July 8th lows of 1.250% and the 38.2% Fibonacci retracement level at 1.227%. Resistance is at the upper trendline of the pennant near 1.394% and the July 6th highs at 1.447%.
Source: Tradingview, City Index
USD/JPY is similar to 10-year yields on the 240-minute chart. The pair traded above the end of March highs (110.97) into the payroll release. Notice the RSI was overbought on the NFP print, and the pair began moving lower with yields. The bounce off of 109.53 on Friday appears to be corrective as the pair forms a pennant (notice the RSI was oversold). A break below 110.00 would target 108.00. The 38.2% Fibonacci retracement from the March 2020 lows to the July 2nd highs doesn’t cross until 107.51. As with yields, if price reaches target, it will not have done damage to the longer-term technical picture.
Source: Tradingview, City Index
The selloff in yields and USD/JPY could be because of any or all the reasons listed above. However, note that the longer-term technical picture has not been damaged and there is still plenty of room to go before that may happen. Does it matter if the CPI is stronger or weaker than expected for June? The technicals point to a possible lower move regardless of the outcome in the short-term. However, that may not be the case for the longer-term picture!
For more information or to trade with CityIndex.com, Click here!
Recall last month when the US released CPI for May and the print was 5% YoY. The markets didn’t know what to think: expectations were already extremely high at 4.7% YoY, and 5% was over the top. Inflation was here to stay! That was on June 10th and 10-year yields were trading at 1.53%. At time, the Fed was arguing that inflation was transitory. But at the Fed’s June FOMC meeting a week later, the dot-plots caught traders off-guard as the Fed seemed to agree that tapering may need to begin sooner than later. Inflation at 5% is much higher than the Fed’s targeted rate of 2%. 10-year yields are currently at 1.366%. USD/JPY, which trades similar to US yields, closed June 10th at 109.31.
On July 13th, the US will release CPI for June. Expectations are for 4.9% YoY. Since the last Fed meeting, speakers have been mixed with some calling for tapering sooner than later. June’s Non-Farm Payroll number was strong, with 850,000 jobs added to the economy. However, last week, bonds moved higher while yields and USD/JPY moved lower. 10-year yields moved from 1.447% down to 1.25% before profit taking ensued on Friday. This was the lowest level for yields since mid-February! USD/JPY sold off from a high of 111.19 on the NFP release down to 109.53 on Thursday, before recovering on Friday. So, after a strong NFP print, yields and USD/JPY fell. This is exactly the opposite of what one may have expected if the Fed was going to begin tapering.
There are a few reasons this may have happened:
- Traders may have been positioned for a stronger print (short bonds and long USD/JPY). Those short bonds were squeezed, and those long USD/JPY were forced to take profits. Therefore, position squaring may have followed the NFP print.
- The unemployment rate upticked from 5.7% to 5.9%. Traders may have been looking at this number rather than the headline number.
- Traders ran for safe-haven bonds and Yen as the Delta variant makes its rounds.
- Traders may have been began looking ahead to the CPI data this week. A 4.9% YoY headline expectation 2 months in a row seems quite strong (How high can the price of used cars go?)
- Traders may have begun to believe that inflation truly is transitory. Was the Fed right after all?
- It’s technical:
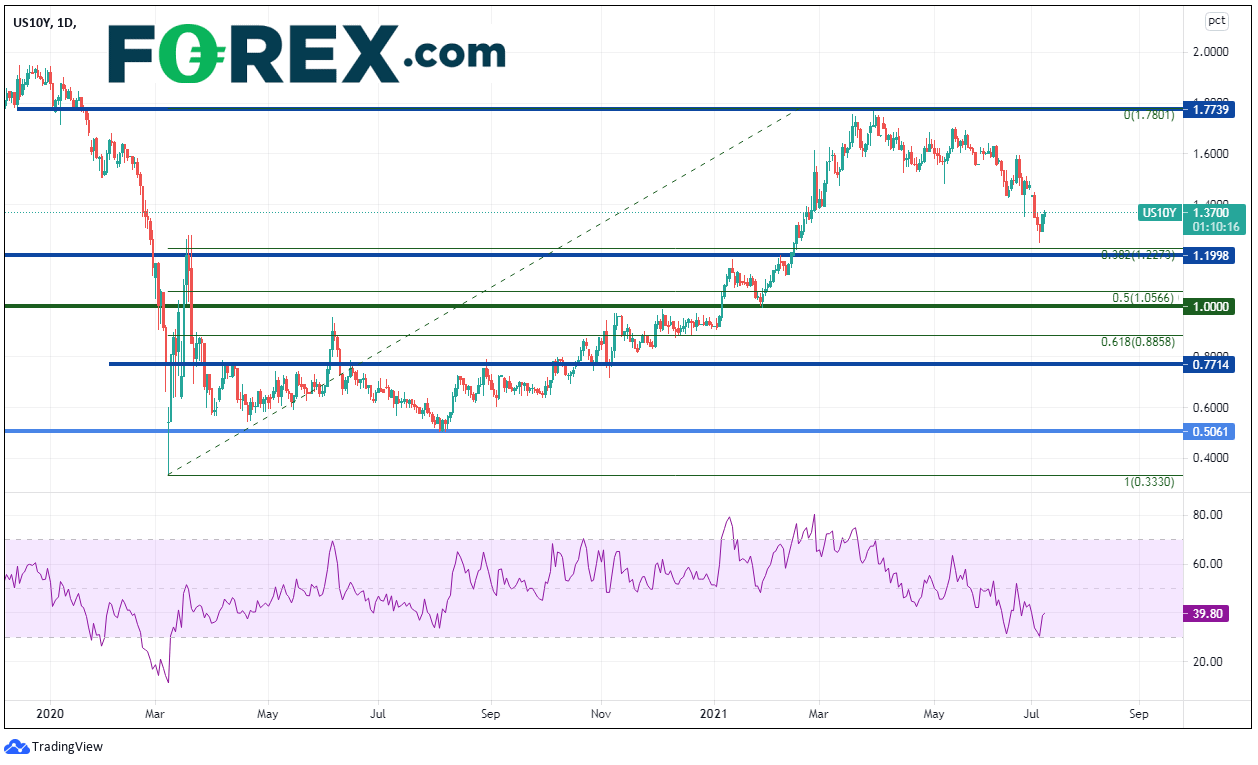
US 10 Year Yields had already retraced 50% on the November 2018 highs to the March 2020 lows on March 29th. As the pullback in yields began (a majority of which occurred last week), it held a few bps above horizontal support and the 38.2% Fibonacci retracement level from the March 2020 lows to the March 29th highs near 1.250%.
Source: Tradingview, FOREX.com
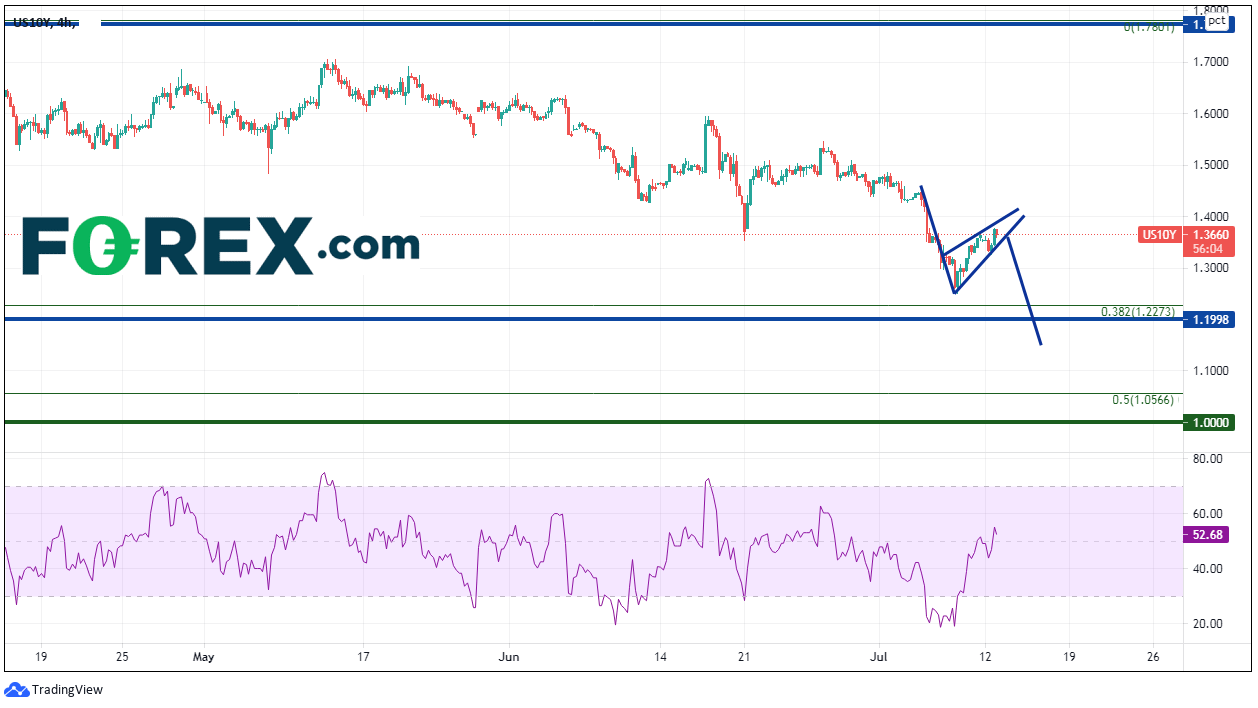
On a 240-minute timeframe the move off the lows on Friday appears that it may be corrective, as yields formed a pennant pattern. If 10-year yields break back below 1.343% (the bottom of the pennant), they could target 1.149%, which wouldn’t do any damage to the longer-term technical picture (see daily chart). However, yields first must break the July 8th lows of 1.250% and the 38.2% Fibonacci retracement level at 1.227%. Resistance is at the upper trendline of the pennant near 1.394% and the July 6th highs at 1.447%.
Source: Tradingview, FOREX.com
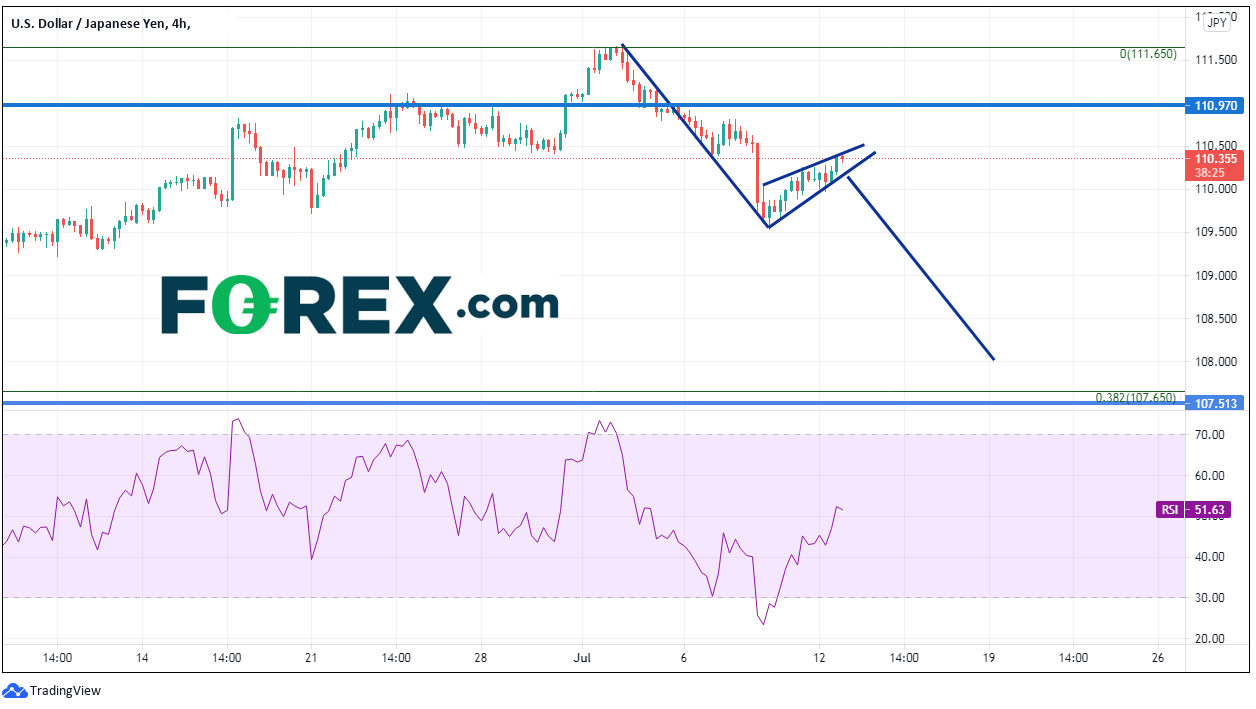
USD/JPY is similar to 10-year yields on the 240-minute chart. The pair traded above the end of March highs (110.97) into the payroll release. Notice the RSI was overbought on the NFP print, and the pair began moving lower with yields. The bounce off of 109.53 on Friday appears to be corrective as the pair forms a pennant (notice the RSI was oversold). A break below 110.00 would target 108.00. The 38.2% Fibonacci retracement from the March 2020 lows to the July 2nd highs doesn’t cross until 107.51. As with yields, if price reaches target, it will not have done damage to the longer-term technical picture.
Source: Tradingview, FOREX.com
The selloff in yields and USD/JPY could be because of any or all the reasons listed above. However, note that the longer-term technical picture has not been damaged and there is still plenty of room to go before that may happen. Does it matter if the CPI is stronger or weaker than expected for June? The technicals point to a possible lower move regardless of the outcome in the short-term. However, that may not be the case for the longer-term picture!
How to trade with Forex.com
Follow these easy steps to start trading with City Index today:
- Open a Forex.com account, or log-in if you’re already a customer.
- Search for the market you want to trade in our award-winning platform.
- Choose your position and size, and your stop and limit levels
- Place the trade.
Related tags:
Latest market news




The complete CFD trading experience
Award-winning platforms, competitive spreads, low commissions and dedicated support.
We live and breathe the markets and are dedicated to helping traders realise their ambitions as we continue to set the industry bar.
Economic calendar
Web Trader platform
Our sophisticated web-based platform is packed with features.
Related articles
USD/JPY Q4 2026 Outlook: Hawkish Fed Pricing Clashes With Intervention Risk
The year-end tug-of-war is clear: hawkish Fed pricing supports USD/JPY, while intervention risk limits the upside.
Japanese Yen Forecast: USD/JPY 4% Rally Challenges Post-Intervention Downtrend 9 24 2026
USD/JPY momentum has shifted sharply higher, putting a major resistance confluence in focus as U.S. and Japanese event risk builds.


Oil Quietly Hands the Fed a Reason to Stay Hawkish
Oil prices and the U.S. dollar are both on the front foot as elevated energy costs feed Fed warnings that inflation may prove sticky.

StoneX Europe Ltd may make third party material available on this website which may contain information included but not limited to the conditions of financial markets. The material is for information purposes only and does not contain, and should not be construed as containing, investment advice and/or investment recommendation and/or an investment research and/or an offer of or solicitation for any transactions in financial instruments; any decision to enter into a specific transaction shall be made by the client following an assessment by him/her of their situation.
StoneX Europe Ltd makes no representation or warranty and assumes no liability as to the accuracy or completeness of the information provided, nor any loss arising from any investment based on a recommendation, forecast or other information supplied. You should always seek independent advice as to your suitability to speculate in any related markets and your ability to assume the associated risks, if you are at all unsure. We are not under any obligation to update any such material. Any opinion made may be personal to the author and may not reflect the opinion of StoneX Europe Ltd.