





Double Whammy for CADJPY
The CAD/JPY has taken a big hit this week
Share this:

The CAD/JPY has taken a big hit this week due to both a weakening Canadian Dollar and a stronger Japanese Yen. The continued hit to Canadian data, this time in the form of weaker inflation data, and the dovish tone of the BOC this week have caused the Canadian Dollar to move lower. In addition, the flight to safety amid concerns of the coronavirus spreading around the global has given strength to the Japanese Yen. As a result, the CAD/JPY is down over 1% on the week so far.
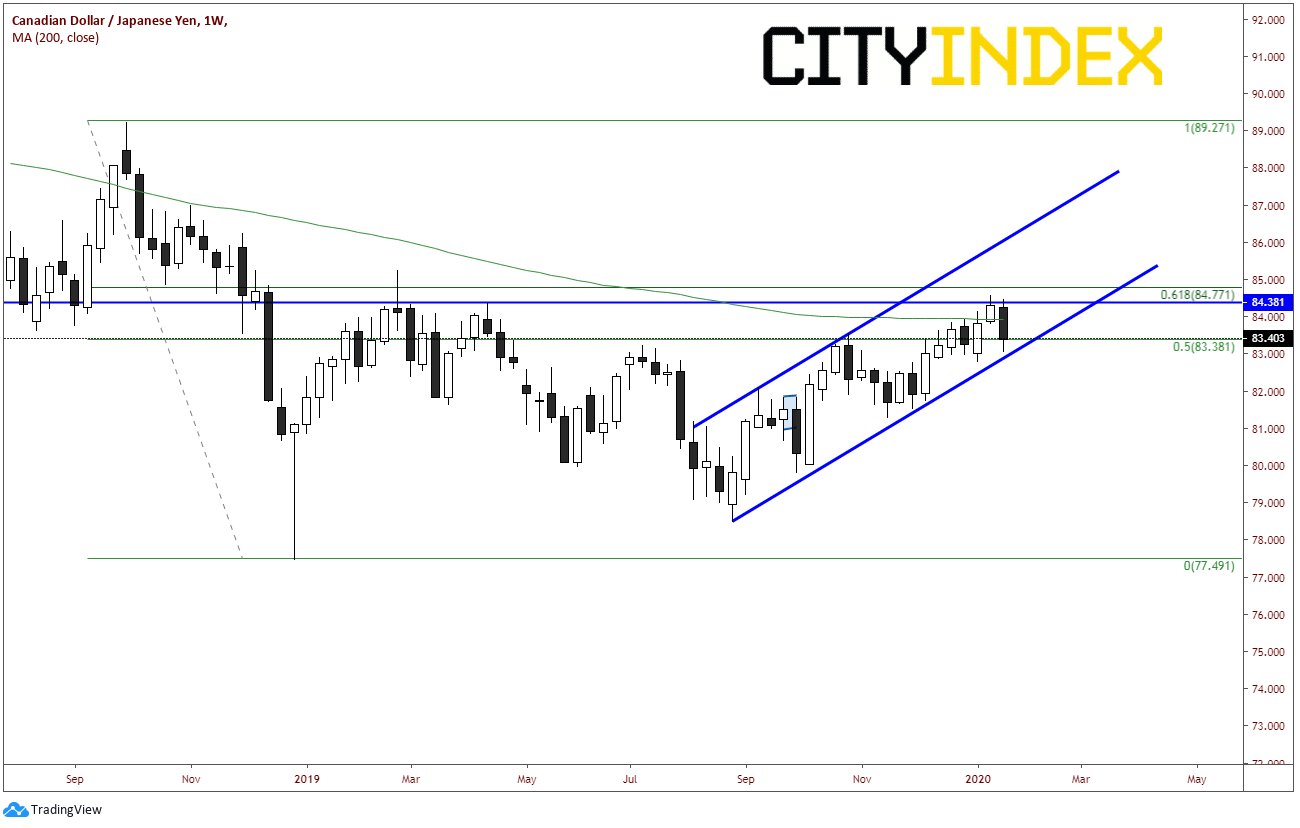
On a weekly chart, CAD/JPY has been in an upward sloping channel since the week of August 26th. Last week, the pair tested, and failed, horizontal resistance, the 200 Day Weekly Moving Average, and the 61.8% retracement from the highs on the week of October 1st, 2018 to the January 2nd, 2019 Yen flash crash lows near 84.40/84.80. In addition, price has gone down and tested the bottom trendline of the upward sloping channel near 83.00. The trendline is holding so far.
Source: Tradingview, City Index
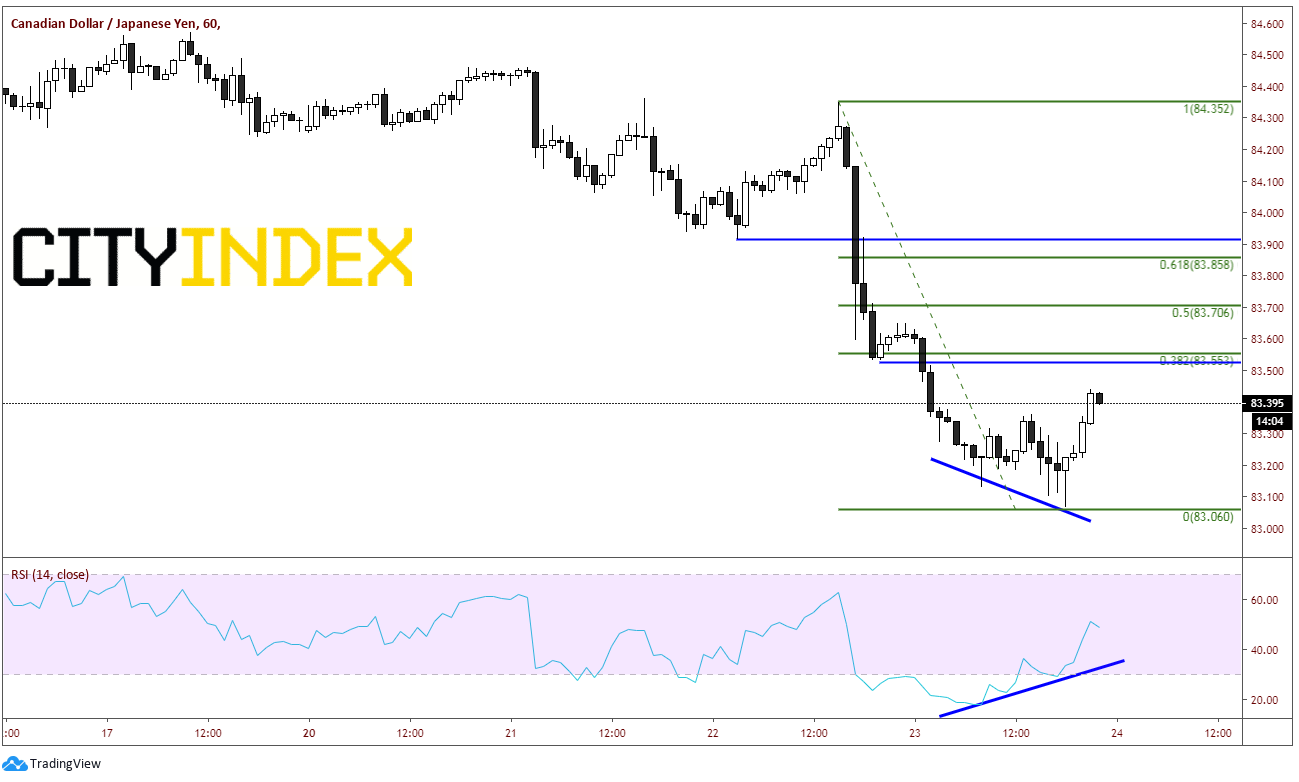
On a short-term 60-minute chart, we can see how much of the weekly move came after yesterday’s dovish BOC rate decision meeting. As CAD/JPY traded lower to near the weekly channel line, price began to diverge with the RSI, and the pair put in a hammer candlestick formation off the low. This was a sign the pair may be ready for a bounce. So far, CAD/JPY bounced slightly but hasn’t been able to take out the horizontal resistance or 38.2% retracement level from the highs before the BOC to today’s hammer how, which is hear 83.50. The 50% retracement level comes across at 83.70, and horizontal resistance and the 61.8% retracement level is neat 83.85/83.90. Support comes in at the day’s lows and the weekly rising channel trendline near 84.00/83.05.
Source: Tradingview, City Index
Below that, horizontal support comes in at 82.75 on a 240-minute timeframe, and they the 38.2% retracement level from the August 23rd, 2019 lows to the January 17th highs near 82.25.
Source: Tradingview, City Index
If there continues to be more verified cases of the coronavirus the Yen may continue to strengthen. In addition, on Friday Canadian Retail Sales for November will be released. Expectations for the headline number are 0.4% vs -1.2% last. If the Canadian data is worse than expected, the Canadian Dollar may continue to weaken. This could be a dangerous combination for the CAD/JPY.
The CAD/JPY has taken a big hit this week due to both a weakening Canadian Dollar and a stronger Japanese Yen. The continued hit to Canadian data, this time in the form of weaker inflation data, and the dovish tone of the BOC this week have caused the Canadian Dollar to move lower. In addition, the flight to safety amid concerns of the coronavirus spreading around the global has given strength to the Japanese Yen. As a result, the CAD/JPY is down over 1% on the week so far.
On a weekly chart, CAD/JPY has been in an upward sloping channel since the week of August 26th. Last week, the pair tested, and failed, horizontal resistance, the 200 Day Weekly Moving Average, and the 61.8% retracement from the highs on the week of October 1st, 2018 to the January 2nd, 2019 Yen flash crash lows near 84.40/84.80. In addition, price has gone down and tested the bottom trendline of the upward sloping channel near 83.00. The trendline is holding so far.
Source: Tradingview, FOREX.com
On a short-term 60-minute chart, we can see how much of the weekly move came after yesterday’s dovish BOC rate decision meeting. As CAD/JPY traded lower to near the weekly channel line, price began to diverge with the RSI, and the pair put in a hammer candlestick formation off the low. This was a sign the pair may be ready for a bounce. So far, CAD/JPY bounced slightly but hasn’t been able to take out the horizontal resistance or 38.2% retracement level from the highs before the BOC to today’s hammer how, which is hear 83.50. The 50% retracement level comes across at 83.70, and horizontal resistance and the 61.8% retracement level is neat 83.85/83.90. Support comes in at the day’s lows and the weekly rising channel trendline near 84.00/83.05.
Source: Tradingview, FOREX.com
Below that, horizontal support comes in at 82.75 on a 240-minute timeframe, and they the 38.2% retracement level from the August 23rd, 2019 lows to the January 17th highs near 82.25.
Source: Tradingview, FOREX.com
If there continues to be more verified cases of the coronavirus the Yen may continue to strengthen. In addition, on Friday Canadian Retail Sales for November will be released. Expectations for the headline number are 0.4% vs -1.2% last. If the Canadian data is worse than expected, the Canadian Dollar may continue to weaken. This could be a dangerous combination for the CAD/JPY.
Related tags:



The complete CFD trading experience
Award-winning platforms, competitive spreads, low commissions and dedicated support.
We live and breathe the markets and are dedicated to helping traders realise their ambitions as we continue to set the industry bar.
Economic calendar
Web Trader platform
Our sophisticated web-based platform is packed with features.
Related articles

EUR/USD Q4 2026 Outlook: Euro at a Crossroads as Fed, ECB Tighten 9 25 2026
EUR/USD enters Q4 at a pivotal inflection point as competing Fed-ECB policy paths and persistent inflation risks collide with major technical support.


USD/JPY Q4 2026 Outlook: Hawkish Fed Pricing Clashes With Intervention Risk
The year-end tug-of-war is clear: hawkish Fed pricing supports USD/JPY, while intervention risk limits the upside.


Japanese Yen Forecast: USD/JPY 4% Rally Challenges Post-Intervention Downtrend 9 24 2026
USD/JPY momentum has shifted sharply higher, putting a major resistance confluence in focus as U.S. and Japanese event risk builds.
StoneX Europe Ltd may make third party material available on this website which may contain information included but not limited to the conditions of financial markets. The material is for information purposes only and does not contain, and should not be construed as containing, investment advice and/or investment recommendation and/or an investment research and/or an offer of or solicitation for any transactions in financial instruments; any decision to enter into a specific transaction shall be made by the client following an assessment by him/her of their situation.
StoneX Europe Ltd makes no representation or warranty and assumes no liability as to the accuracy or completeness of the information provided, nor any loss arising from any investment based on a recommendation, forecast or other information supplied. You should always seek independent advice as to your suitability to speculate in any related markets and your ability to assume the associated risks, if you are at all unsure. We are not under any obligation to update any such material. Any opinion made may be personal to the author and may not reflect the opinion of StoneX Europe Ltd.