



Dow Analysis: DJIA Nears 18-Month Highs After Benign CPI Data
The Dow is holding near 18-month highs, and a break above 35,700 resistance could pave the way for a continuation toward 36K or even the record highs at 37K.
Share this:

DJIA Takeaways
- The DJIA has been outperforming the previously high-flying Nasdaq 100 for the last three weeks, marking a potential turning point in the growth vs. value trade.
- Benign CPI data and the uptick in initial unemployment claims reduces the odds of another Fed rate hike next month.
- The Dow is holding near 18-month highs, and a break above 35,700 resistance could pave the way for a continuation toward 36K or even the record highs at 37K.
DJIA Fundamental Analysis
With the vast majority of earnings season behind us, it’s clear that large publicly-traded corporations were able to capitalize on Q2’s economic backdrop by more than expected. According to the earnings mavens at FactSet, nearly 80% of the companies in the S&P 500 beat earnings estimates, and roughly two-thirds beat analysts’ revenue estimates.
At the same time, investors have been rotating slightly away from the fast-growing-but-highly-valued technology and communications stocks that have driven much of this year’s rally in favor of so-called “value” stocks. At an index level, this shift has benefited the Dow Jones Industrial Average (DJIA) at the expense of the previously high-flying Nasdaq 100 (NDX), with the former rising roughly 3% from July 19th, while the former has fallen by more than 3% over the same period.
Whether this brief period of value over growth outperformance continues remains to be seen, but after such a long period of strength in growth stocks, readers should at least be monitoring this potential turning point.
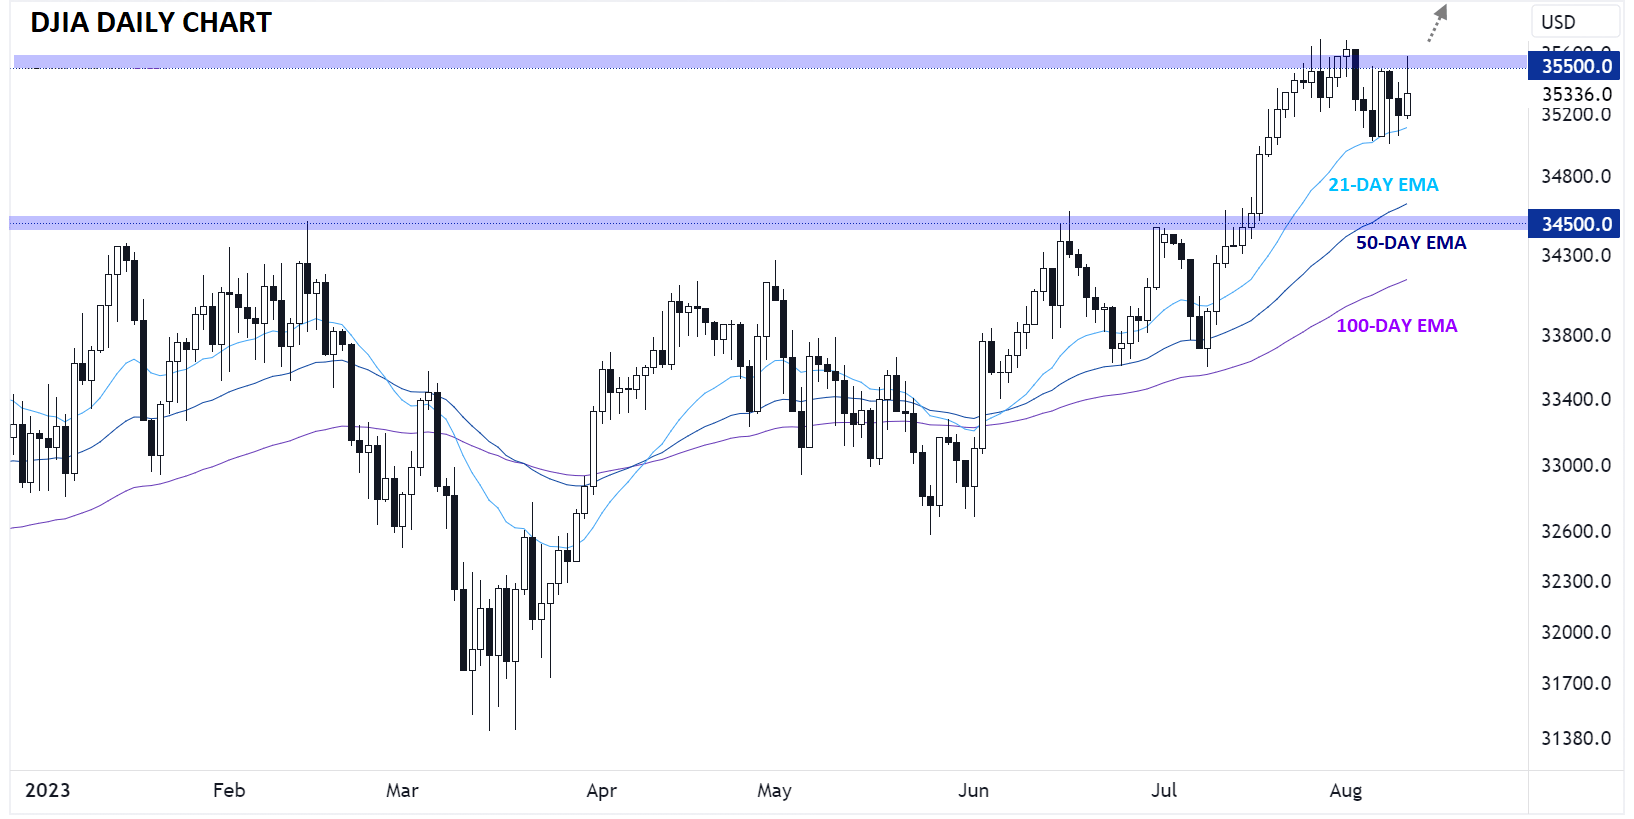
Dow Technical Analysis – DJIA Daily Chart
Source: TradingView, StoneX
Turning our attention to the daily chart, we can see that DJIA had a strong rally to nearly 35,600 on the back of this morning’s slightly-softer-than-expected CPI reading and the uptick in initial unemployment claims, two data points that reduce the odds of another interest rate hike from the Federal Reserve. However, as we go to press, the index is pulling back from its intraday highs to trade back into the 35,300s.
Taking a step back, the index remains in a clear uptrend, with prices holding near their 18-month highs and all the major moving averages trending higher. As long as this week’s low near 35,000 holds, the short-term path of least resistance will remain to the topside, with a break above 35,700 signaling another leg up toward 36,000 or even the record highs near 37,000 next. Meanwhile, a break below this week’s lows could expose the 50-day EMA and previous-resistance-turned-support in the mid 34,000s.
-- Written by Matt Weller, Global Head of Research
Follow Matt on Twitter: @MWellerFX
Latest market news




The complete CFD trading experience
Award-winning platforms, competitive spreads, low commissions and dedicated support.
We live and breathe the markets and are dedicated to helping traders realise their ambitions as we continue to set the industry bar.
Economic calendar
Web Trader platform
Our sophisticated web-based platform is packed with features.
Related articles

S&P 500, Nasdaq, Dow Forecast: Wall Street Split Widens Into Month-End 9 26 2026
Nasdaq strength contrasts with mounting Dow pressure as rising Treasury yields raise the stakes for stocks heading into the monthly close.


Equity Indices Q4, 2026 Outlook: Cracks Begin to Show
There's still an open door for a melt-up in the S&P 500 and Nasdaq but the Dow and Russell 2000 are looking more vulnerable, and until calm hits the Treasuries market there's a higher probability for volatility. The big question is whether that's a next quarter theme or not.

USD/JPY Q4 2026 Outlook: Hawkish Fed Pricing Clashes With Intervention Risk
The year-end tug-of-war is clear: hawkish Fed pricing supports USD/JPY, while intervention risk limits the upside.

StoneX Europe Ltd may make third party material available on this website which may contain information included but not limited to the conditions of financial markets. The material is for information purposes only and does not contain, and should not be construed as containing, investment advice and/or investment recommendation and/or an investment research and/or an offer of or solicitation for any transactions in financial instruments; any decision to enter into a specific transaction shall be made by the client following an assessment by him/her of their situation.
StoneX Europe Ltd makes no representation or warranty and assumes no liability as to the accuracy or completeness of the information provided, nor any loss arising from any investment based on a recommendation, forecast or other information supplied. You should always seek independent advice as to your suitability to speculate in any related markets and your ability to assume the associated risks, if you are at all unsure. We are not under any obligation to update any such material. Any opinion made may be personal to the author and may not reflect the opinion of StoneX Europe Ltd.