



Dow Outlook: 50,000 Threshold Faces NFP, CPI, and Earnings Volatility Risks
Dow Outlook: Rotations out of AI capped gains across the S&P 500 and Nasdaq and boosted the Dow above 50,000. However, this dispersion is slowing, with declining risk appetite ahead of key industrial earnings, CPI, and NFP reports this week.
Share this:

Key Events
• The Dow’s surge above the 50,000 mark, in line with widening dispersion versus the Nasdaq and S&P 500, is set to be tested this week with industrial-focused earnings alongside US NFP and CPI reports.
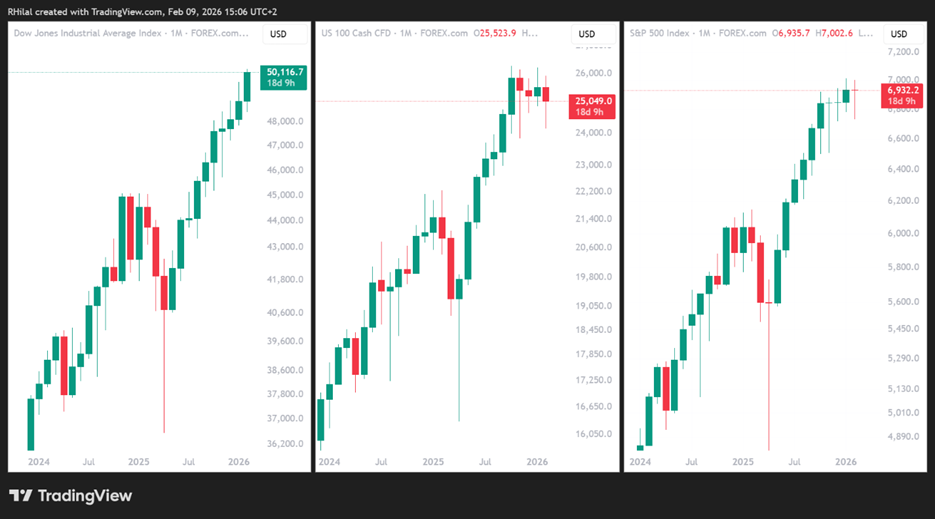
The AI-driven rotation out of software and into value and cyclical sectors has lifted the Dow above 50,000, while capping gains across the Nasdaq below the 26,000 mark and the S&P 500 below the 7,000 mark, keeping critical dispersion and key higher-timeframe levels in focus.

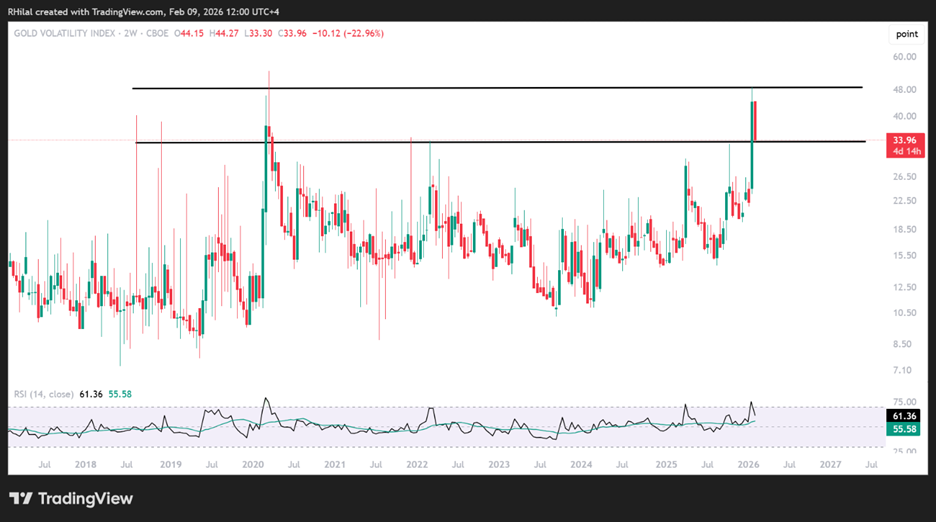
A chart that stood out to me is the gold volatility index, which pulled back from highs last seen in 2020 to retest a critical zone that previously acted as resistance in 2022 and 2025, raising the risk of a potential rebound in broader market volatility.
Gold Volatility Index (GVX) – Monthly Time Frame – Log Scale
Source: Trading view
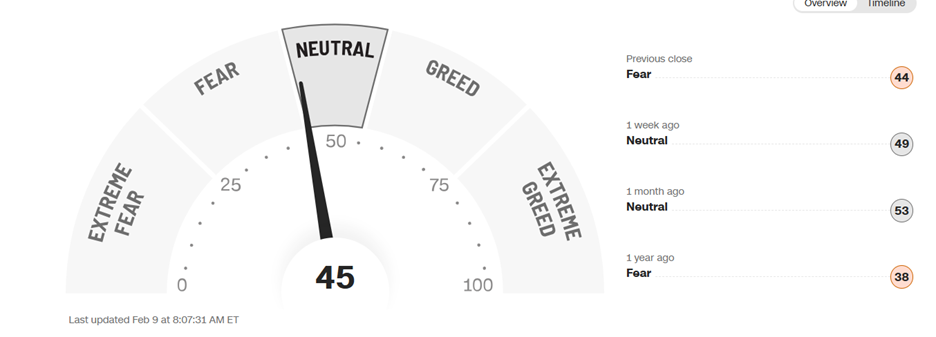
Translating this caution into the market’s sentiment:
CNN Fear and Greed Index
Source: Trading view
Market sentiment is leaning toward the bearish side as we move further into February, amplifying mean-reversion risks, while the Dow’s price action holds above the 50,000 mark ahead of key earnings among mid- and large-cap stocks, focused on industrials, financials, energy, and healthcare.
Dow, Nasdaq, SP500 Outlook – Monthly Time Frame – Log Scale
Source: Trading view
From a technical angle, as long as the Dow holds above the 50,000 mark, the upside bias is expected to persist. However, a slowdown in activity is becoming visible through the widening divergence with the Nasdaq and S&P 500, as well as ahead of Friday’s US CPI release, with expectations leaning toward steady inflation readings and an improvement in NFP figures relative to the previous release. With volatility risks building, key levels remain in focus to separate short-term noise from long-term structure.
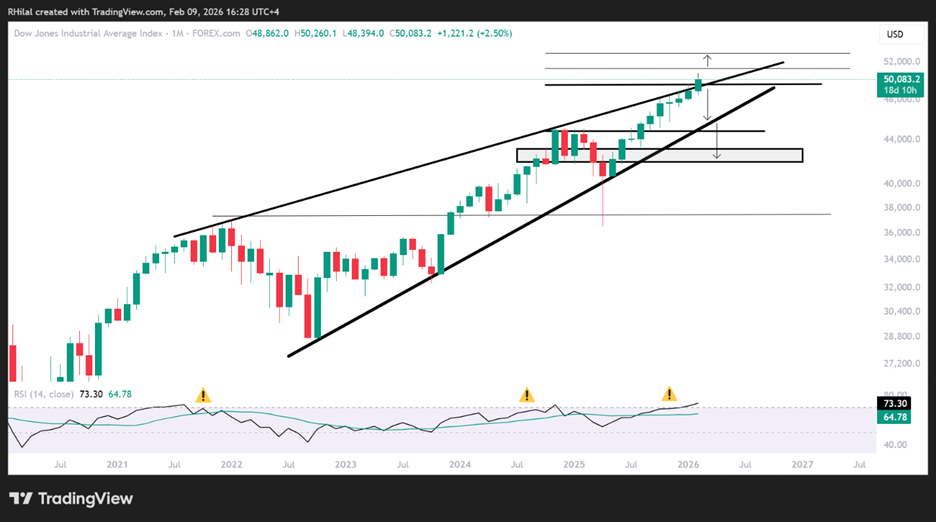
Dow Jones Outlook: Monthly Time Frame – Log Scale
Source: Trading view
From a monthly perspective, Dow Jones price action is attempting to break beyond the bounds of a diagonal consolidation originating from the 2020 lows. Markets are repricing long-term risk exposure across AI-focused sectors amid capex and revenue concerns; however, the steep nature of recent price action warrants caution, in line with the declining market greed index highlighted by the CNN Fear and Greed indicator.
This divergence is creating an imbalanced environment, keeping key levels in focus to confirm potential shifts within these primary uptrends.
This extended consolidation structure raises the risk of a sharp drawdown before a bullish continuation. A move back below the 50,000 mark would extend retracement risks toward 49,400, a level that could realign price action back into the 50,000 zone. Failing that, a deeper drawdown may unfold toward 48,800 and 48,500, followed by a further 1,000-point extension to 47,500 and 47,000, before exposing the 45,000 threshold. This level aligns with the lower bound of the consolidation range and a key resistance zone from 2024 and February 2025.
On the upside, holding above the 50,200 mark is expected to extend gains further toward levels 51,200 and 53,000 respectively.
The distribution observed between December 2024 and February 2025 risks repeating into the end of Q1 2025, potentially serving as a reset phase to recharge momentum and realign with the broader uptrend.
From a momentum perspective, the monthly RSI continues to signal drawdown risks, as it remains extended in overbought territory—a condition that has historically preceded deeper corrective phases on the Dow, as illustrated in the chart above.
Written by Razan Hilal, CMT
Follow on X: @Rh_waves
Related tags:
Latest market news



The complete CFD trading experience
Award-winning platforms, competitive spreads, low commissions and dedicated support.
We live and breathe the markets and are dedicated to helping traders realise their ambitions as we continue to set the industry bar.
Economic calendar
Web Trader platform
Our sophisticated web-based platform is packed with features.
Related articles

Equity Indices Q4, 2026 Outlook: Cracks Begin to Show
There's still an open door for a melt-up in the S&P 500 and Nasdaq but the Dow and Russell 2000 are looking more vulnerable, and until calm hits the Treasuries market there's a higher probability for volatility. The big question is whether that's a next quarter theme or not.


GBP/USD, DJIA Outlook: Support Levels Meet Oversold Risks
GBP/USD and the Dow test key support levels as rising Treasury yields, Fed rate-hike expectations and oversold momentum increase reversal risks.

EUR/USD, Nasdaq Price Outlook: Reversal Risks Build
EUR/USD and Nasdaq Price Outlook: Overbought/oversold momentum on hourly and daily time frames is raising reversal risks across the U.S. dollar, EUR/USD and Nasdaq after a strong weekly advance.
StoneX Europe Ltd may make third party material available on this website which may contain information included but not limited to the conditions of financial markets. The material is for information purposes only and does not contain, and should not be construed as containing, investment advice and/or investment recommendation and/or an investment research and/or an offer of or solicitation for any transactions in financial instruments; any decision to enter into a specific transaction shall be made by the client following an assessment by him/her of their situation.
StoneX Europe Ltd makes no representation or warranty and assumes no liability as to the accuracy or completeness of the information provided, nor any loss arising from any investment based on a recommendation, forecast or other information supplied. You should always seek independent advice as to your suitability to speculate in any related markets and your ability to assume the associated risks, if you are at all unsure. We are not under any obligation to update any such material. Any opinion made may be personal to the author and may not reflect the opinion of StoneX Europe Ltd.