



ECB flips to a more hawkish tone
Although the ECB pledged to speed up the pace of bond tapering, it also increased its forecast for inflation and lowered its forecast for growth.
Share this:

At the February ECB meeting, the central bank reiterated that it would be ending PEPP in March but continue buying bonds under the Asset Purchase Program at a pace of 40 billion Euros a month in Q2, 30 billion Euros a month in Q3 and 20 billion Euros a month in Q4. However, due to the continued increase in inflation since the last meeting, all that has changed! CPI for February rose to 5.8% YoY from 5.1% YoY in January. ECB members knew they had to do something, and they did.
In the statement, the ECB dropped the language suggesting that rates could be lower than they currently forecast. In addition, it dropped the pledge to end APP “shortly” before rates raise. It also announced a faster winding down of their asset program. PEPP will still end in March. However, it will now only purchase 40 billion Euros worth of bonds in April, 30 billion Euros worth of bonds in May, and 20 billion Euros work of bonds in June. This would effectively end the bond purchase program in Q3, rather than Q4.
The ECB also changed its forecasts for inflation and growth. Previously, the central bank had forecast inflation at 3.2% for 2022, 1.8% for 2023, and 1.8% for 2024. These forecasts all have been revised higher. The ECB now forecasts inflation at 5.1% for 2022, 2.1% for 2023 and 1.9% for 2024. This is a large revision to the 2022 forecast! Note that the ECB targets 2% inflation. Regarding growth, forecasts were lowered. Previously, the ECB had forecast growth at 4.2% for 2022, 2.9% for 2023. These forecasts have been revised lower. The ECB now forecasts growth at only 3.7% for 2022 and 2.8% for 2023. In a nutshell, higher revisions were made for inflation and lower revisions were made to growth!
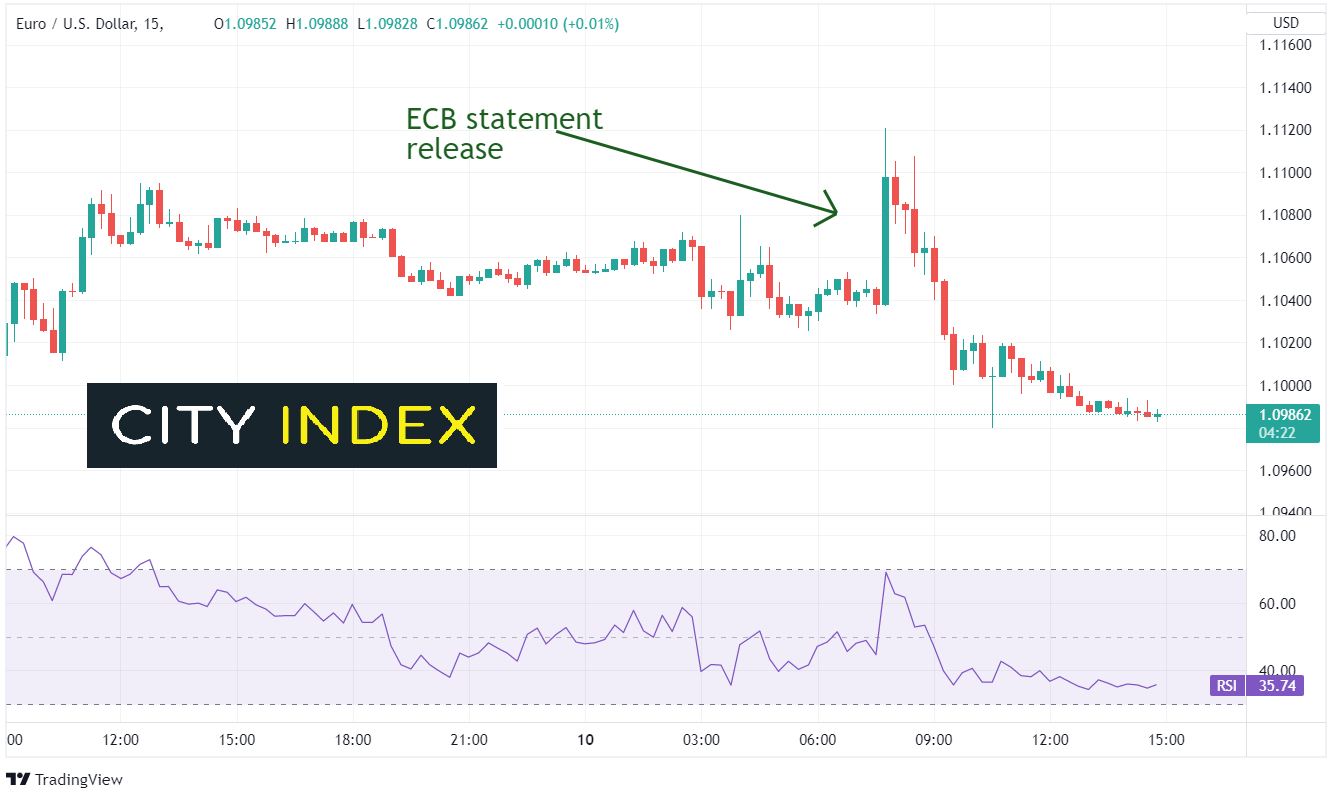
EUR/USD had initially gone bid on the hawkish statement, however had later pulled back as traders used the opportunity to sell the bounce on the risk-off move in stocks. High inflation and lower growth lead to stagflation, which investors don’t like! In addition, although there had been a 3rd meeting between Russian and Ukraine officials, the meeting ended without any further progress. Therefore, traders were happy to buy US Dollars at better levels on the bounce.

Source: Tradingview, Stone X
On a daily timeframe, EUR/USD bounced off the 161.8% Fibonacci extension from the lows of January 28th to the highs of February 10th near 1.0890. Also, notice the horizontal long-term trendline at the lows which dates to January 2017! When the pair bounced after the meeting, it stopped abruptly at the previous lows (now resistance) at 1.1121. First support is at the long-term trendline and the March 7th lows near 1.0806. Below there is horizontal support at 1.0727, which is the lows from April 2020. Resistance is at Thursday’s high (and the lows of January 28th) at 1.1121, then the top downward sloping trendline dating back to May 2021 near 1.1200.

Source: Tradingview, Stone X
Although the ECB pledged to speed up the pace of bond tapering due to increased inflation, it also increased its forecast for inflation and lowered its forecast for growth. Markets took this as a negative and sold EUR/USD after an initial bounce. Watch previous lows and the long-term trendline to see if it can hold!
At the February ECB meeting, the central bank reiterated that it would be ending PEPP in March but continue buying bonds under the Asset Purchase Program at a pace of 40 billion Euros a month in Q2, 30 billion Euros a month in Q3 and 20 billion Euros a month in Q4. However, due to the continued increase in inflation since the last meeting, all that has changed! CPI for February rose to 5.8% YoY from 5.1% YoY in January. ECB members knew they had to do something, and they did.
In the statement, the ECB dropped the language suggesting that rates could be lower than they currently forecast. In addition, it dropped the pledge to end APP “shortly” before rates raise. It also announced a faster winding down of their asset program. PEPP will still end in March. However, it will now only purchase 40 billion Euros worth of bonds in April, 30 billion Euros worth of bonds in May, and 20 billion Euros work of bonds in June. This would effectively end the bond purchase program in Q3, rather than Q4.
The ECB also changed its forecasts for inflation and growth. Previously, the central bank had forecast inflation at 3.2% for 2022, 1.8% for 2023, and 1.8% for 2024. These forecasts all have been revised higher. The ECB now forecasts inflation at 5.1% for 2022, 2.1% for 2023 and 1.9% for 2024. This is a large revision to the 2022 forecast! Note that the ECB targets 2% inflation. Regarding growth, forecasts were lowered. Previously, the ECB had forecast growth at 4.2% for 2022, 2.9% for 2023. These forecasts have been revised lower. The ECB now forecasts growth at only 3.7% for 2022 and 2.8% for 2023. In a nutshell, higher revisions were made for inflation and lower revisions were made to growth!
EUR/USD had initially gone bid on the hawkish statement, however had later pulled back as traders used the opportunity to sell the bounce on the risk-off move in stocks. High inflation and lower growth lead to stagflation, which investors don’t like! In addition, although there had been a 3rd meeting between Russian and Ukraine officials, the meeting ended without any further progress. Therefore, traders were happy to buy US Dollars at better levels on the bounce.

Source: Tradingview, Stone X
Trade EUR/USD now: Login or Open a new account!
• Open an account in the UK
• Open an account in Australia
• Open an account in Singapore
On a daily timeframe, EUR/USD bounced off the 161.8% Fibonacci extension from the lows of January 28th to the highs of February 10th near 1.0890. Also, notice the horizontal long-term trendline at the lows which dates to January 2017! When the pair bounced after the meeting, it stopped abruptly at the previous lows (now resistance) at 1.1121. First support is at the long-term trendline and the March 7th lows near 1.0806. Below there is horizontal support at 1.0727, which is the lows from April 2020. Resistance is at Thursday’s high (and the lows of January 28th) at 1.1121, then the top downward sloping trendline dating back to May 2021 near 1.1200.
Source: Tradingview, Stone X
Although the ECB pledged to speed up the pace of bond tapering due to increased inflation, it also increased its forecast for inflation and lowered its forecast for growth. Markets took this as a negative and sold EUR/USD after an initial bounce. Watch previous lows and the long-term trendline to see if it can hold!
Learn more about forex trading opportunities.
Related tags:


The complete CFD trading experience
Award-winning platforms, competitive spreads, low commissions and dedicated support.
We live and breathe the markets and are dedicated to helping traders realise their ambitions as we continue to set the industry bar.
Economic calendar
Web Trader platform
Our sophisticated web-based platform is packed with features.
Related articles

US Dollar Technical Outlook: DXY Bulls Meet Resistance at Yearly Highs 10 1 2026
The U.S. Dollar has held firm despite fading Fed hike bets, but Friday’s payrolls could test the rally’s staying power.


Dow Jones forecast: Stock markets under pressure from multiple sources
When looking at the major tech-heavy US indices like the S&P 500 or the Nasdaq 100, you wouldn’t think that the stock market is particularly weak. Yet, beneath the surface, the market is far from healthy right now. Investors are evidently just piling into the big tech and AI names, and as a result, market breadth is deteriorating. Other indices like the small cap Russell 2000 and the Dow Jones are starting to reflect that weakness.


Nikkei breakout accelerates as yen weakness returns
Nikkei has started October with a powerful breakout, helped by renewed yen weakness and strong upside momentum

StoneX Europe Ltd may make third party material available on this website which may contain information included but not limited to the conditions of financial markets. The material is for information purposes only and does not contain, and should not be construed as containing, investment advice and/or investment recommendation and/or an investment research and/or an offer of or solicitation for any transactions in financial instruments; any decision to enter into a specific transaction shall be made by the client following an assessment by him/her of their situation.
StoneX Europe Ltd makes no representation or warranty and assumes no liability as to the accuracy or completeness of the information provided, nor any loss arising from any investment based on a recommendation, forecast or other information supplied. You should always seek independent advice as to your suitability to speculate in any related markets and your ability to assume the associated risks, if you are at all unsure. We are not under any obligation to update any such material. Any opinion made may be personal to the author and may not reflect the opinion of StoneX Europe Ltd.