



EUR/USD, EUR/AUD forecast: Is the tide turning for the euro?
Several of the key headwinds that hammered the euro earlier this year are starting to fade. Here's why the balance of risks may finally be shifting.
Share this:

- Euro headwinds continue to fade rapidly
- EUR/USD bounce risks continue building
- EUR/AUD offers stronger bullish setup
- Warsh panel appearance, payrolls loom as key directional catalysts
Euro headwinds begin to fade
The euro has spent the past few months on the back foot, driven by a combination of U.S. economic resilience, energy insecurity stemming from the Iran-US war, concerns that an aggressive ECB tightening cycle could crimp growth, and, more recently, a hawkish shift from the Federal Reserve.
But that mix is now beginning to shift.
With crude oil prices back around pre-war levels, the energy insecurity headwind has largely disappeared. At the same time, fading expectations for further aggressive ECB tightening reduce the risk that higher borrowing costs will push the euro area into a sharper economic slowdown.
Across the Atlantic, the backdrop has also become less supportive for the greenback. Markets have substantially pared expectations for additional Federal Reserve tightening over the next 12 months, dragging U.S. Treasury yields lower in the process. Taken together, those shifts suggest several of the forces that drove EUR/USD sharply lower are beginning to unwind, increasing the likelihood that a swing low may now be in place.
Bigger catalysts lie ahead
Source: TradingView (BST)
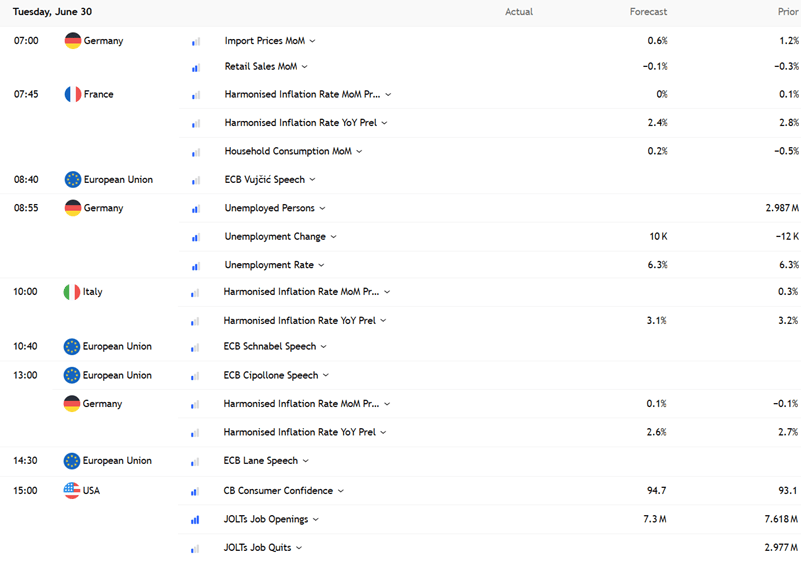
The economic calendar is undeniably busy on Tuesday, headlined by a raft of national euro area inflation reports ahead of Wednesday's aggregate CPI release. Under normal circumstances, those figures would carry significant weight. But they're increasingly backward-looking given the sharp retracement in energy prices following the Iran-US war ceasefire.
Across the Atlantic, the focus falls on JOLTS job openings. While the report has the potential to move markets, its signalling value has been questionable of late. Last month's outsized jump in vacancies wasn't matched by any meaningful change in hiring or quits, raising the possibility of a reversal if today's release aligns with consensus expectations.
A such, today's calendar looks busy on paper, but it's difficult to see these releases having a lasting impact on EUR/USD. Any reaction is likely to be quickly superseded by Kevin Warsh's appearance at the ECB's Sintra forum on Wednesday and, more importantly, Thursday's U.S. non-farm payrolls report, which remains the key event risk for the week.
A swing low may be forming
Source: TradingView
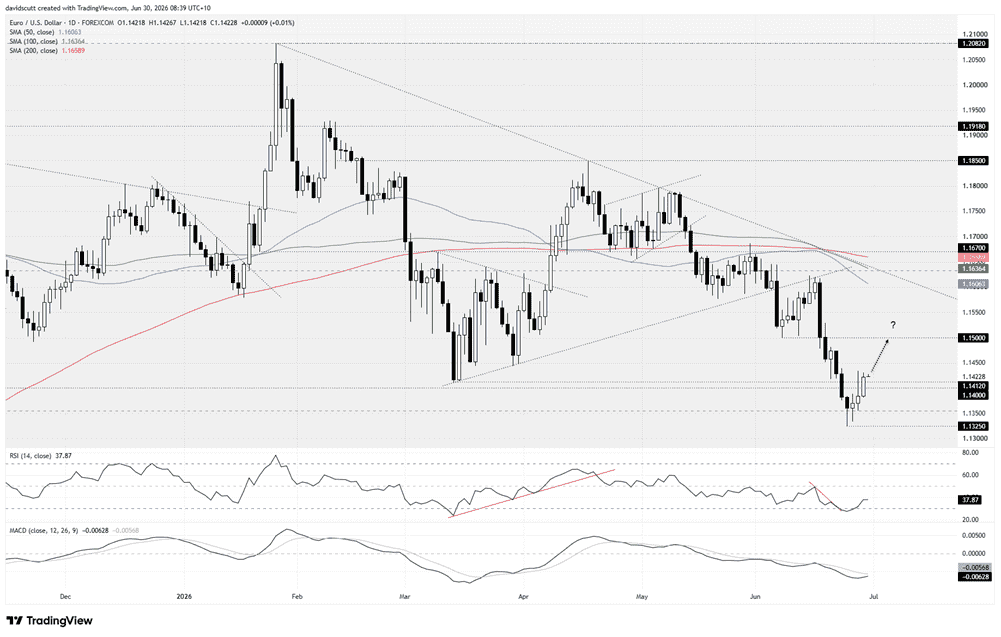
The technical backdrop is looking increasingly constructive for EUR/USD, although it's still too early to call a definitive bottom. The latest bounce came from the 38.2% Fibonacci retracement of the 2025 low-2026 YTD high before the pair reclaimed the former support zone between the March 2026 swing low at 1.1412 and the July 2025 swing low at 1.1400. The final three candles from last week resemble a Morning Star three-candle reversal pattern, with Monday's strong follow-through adding weight to the view that a near-term swing low may be in place.
That leaves the 1.1400-1.1412 zone as the immediate focal point. As long as price holds above it, longs could be considered with a stop beneath the lower boundary, targeting an initial retest of 1.1500, the former support level that gave way during the latest leg lower. A sustained move back beneath 1.1400 would scupper the case for an extension of the latest bounce, suggesting the broader bearish trend remains intact.
For now, upside still looks limited. A break above 1.1500 would bring the 23.6% Fib of the 2025 low-2026 YTD high at 1.1633 into view. Above that sits a heavy band of resistance from the 50, 100 and 200-day moving averages between 1.1606 and 1.1659, along with downtrend resistance extending from the January highs. While a bounce is the preferred scenario, it looks more like a corrective one more than the start of a more meaningful trend reversal.
The momentum indicators also fit with that view. RSI (14) remains below the neutral 50 level, suggesting downside momentum remains, although it has eased noticeably over the past week. MACD also looks close to delivering a bullish crossover, albeit in negative territory, providing another indication that bearish momentum may be starting to fade.
EUR/AUD bulls gaining control
Source: TradingView
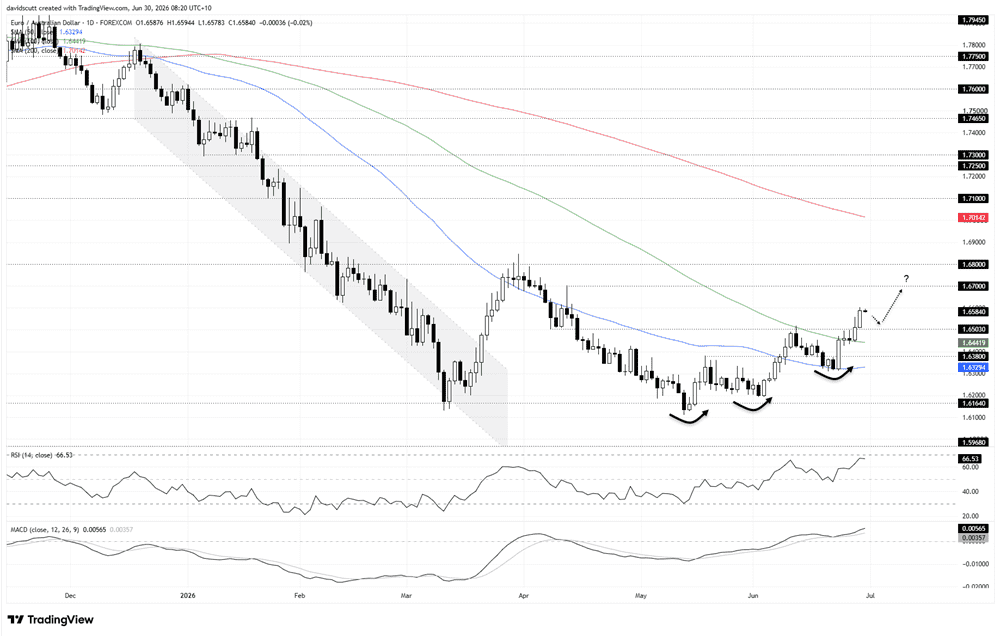
The technical picture in EUR/AUD is far more bullish in comparison. The pair has broken above 1.6503, a level that has acted as both support and resistance in recent months, making it the immediate focal point on the downside. We're also seeing a sequence of higher highs and higher lows emerge, consistent with a developing bullish trend. While a break above the late March swing high at 1.6700 would be needed to confirm that more definitively, the price action is certainly heading in the right direction, leaving the bias firmly skewed towards buying dips rather than fading strength.
With price now sitting roughly midway between support and the initial upside target, it's not the most appealing setup to chase. Instead, the preferred strategy would be to wait for a pullback towards 1.6503, improving the risk-reward profile while allowing the former breakout level to be used as protection against a reversal of the latest bullish move. If that setup were to materialise, longs could be considered above 1.6503 with a tight stop beneath, targeting the late March swing high at 1.6700 initially before attention shifts to 1.6800, a level that has repeatedly acted as both support and resistance over recent years. Beyond that, the 200-day moving average at 1.7014 comes into view should the rally have further legs.
The oscillators continue to reinforce that view. RSI (14) continues to carve out higher highs and higher lows and, at around 66, has yet to reach overbought territory. MACD is also trending higher in positive territory and continues to diverge from the signal line, pointing to strengthening upside momentum.
Only a sustained move back beneath 1.6503 would start to question the bullish outlook. Even then, the 100-day moving average at 1.6442 and the former support and resistance level at 1.6380, which sits alongside the 50-day moving average, should provide an indication as to whether the latest breakout has genuinely failed.
Latest market news



The complete CFD trading experience
Award-winning platforms, competitive spreads, low commissions and dedicated support.
We live and breathe the markets and are dedicated to helping traders realise their ambitions as we continue to set the industry bar.
Economic calendar
Web Trader platform
Our sophisticated web-based platform is packed with features.
Related articles
US Dollar, GBP/USD, USD/CAD, USD/CHF, Gold Weekly Technical Outlook 11 2 2026
Sr. Technical Strategist Michael Boutros highlights the levels that matter on the USD Majors, commodities, and equity indices charts this week.

US Midterm Forecast: The Key Risks for Traders to Watch Through the US Elections
Prediction markets are pricing in nearly 75% odds of a Democratic sweep in this week’s US midterm elections, a development that would result in a split from the single party Republican rule of the past two years - what will it mean for markets?

Gold forecast: XAU/USD stabilised after recent falls – for now
Gold has started the first week of the new month trying to recover some ground after another bruising week. Oil prices have taken a sharp drop and that has allowed risk assets to bounce back, which has clearly helped the precious metal too. However, with sentiment remaining bearish towards the metals, and with $4000 level having been taken out last week, the path of least resistance is to the downside for gold.

StoneX Europe Ltd may make third party material available on this website which may contain information included but not limited to the conditions of financial markets. The material is for information purposes only and does not contain, and should not be construed as containing, investment advice and/or investment recommendation and/or an investment research and/or an offer of or solicitation for any transactions in financial instruments; any decision to enter into a specific transaction shall be made by the client following an assessment by him/her of their situation.
StoneX Europe Ltd makes no representation or warranty and assumes no liability as to the accuracy or completeness of the information provided, nor any loss arising from any investment based on a recommendation, forecast or other information supplied. You should always seek independent advice as to your suitability to speculate in any related markets and your ability to assume the associated risks, if you are at all unsure. We are not under any obligation to update any such material. Any opinion made may be personal to the author and may not reflect the opinion of StoneX Europe Ltd.