






EURCHF Its All about the RSI
When there are diverging RSIs with price, across multiple timeframes, odds increase of a reversal in price.
Share this:

Yes, it’s true the EUR/USD has had six straight down days entering today. However, just because the EUR/USD has been moving lower lately, it does not justify the move lower in EUR/CHF, which has been moving lower since late October! But is it time for the pair to bounce? When we look at the EUR/CHF across multiple timeframes, they all seem to have one thing in common, the RSI is diverging with price!
According to Investopedia, the Relative Strength Index (RSI) is a momentum indicator that measures the magnitude of recent price changes to evaluate overbought or oversold conditions in the prices of a stock or other asset. The RSI is displayed as an oscillator and can have a reading from 0 to 100. An RSI with a value above 70 is considered overbought and a reading of below 30 indicates oversold. A bullish divergence occurs when the RSI creates an oversold reading followed by a higher low that matches correspondingly lower lows in price. A bearish divergence occurs when the RSI creates an overbought reading, followed by a lower high that matches correspondingly higher highs in price.
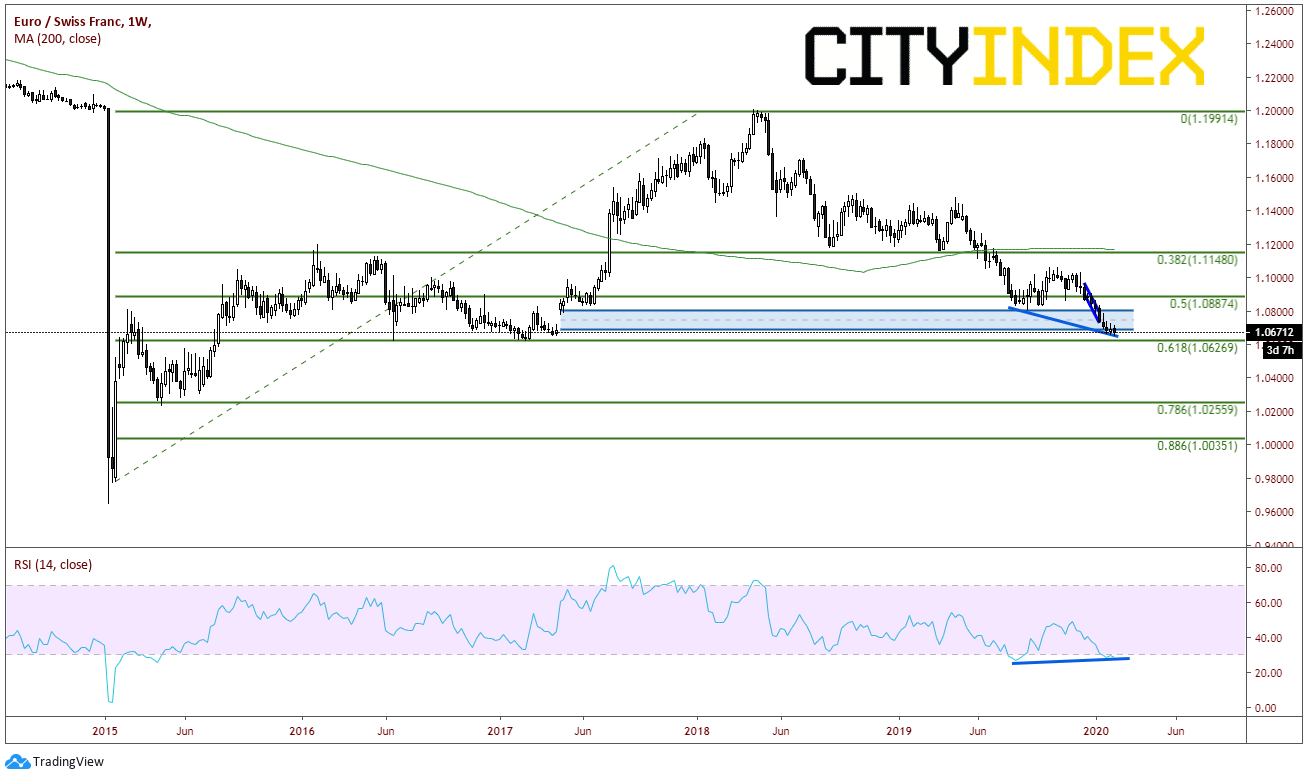
On a weekly timeframe, EUR/CHF has been moving lower in earnest since mid-May 2018. Price is currently at 1.0670, very close to the 61.8% retracement level from the January 2015 lows (when the SNB pulled the 1.2000 EUR/CHF peg) to the May 2018 highs, which also represents horizontal support. Price has filled the gap from mid-April 2017. Notice how the RSI is diverging from price. Price is making a lower low and the RSI is making a higher low, which is a bullish divergence:
Source: Tradingview, City Index
On a daily timeframe, one only needs to go back to January 24th to see the divergence. Price is putting in lower lows as the RSI is putting in higher lows (a bullish divergence):
Source: Tradingview, City Index
Even on a 240-minute timeframe, one only needs to go back to January 28th to see that the RSI and price are diverging (bullish divergence):
Source: Tradingview, City Index
What does it mean when price is diverging with the RSI? This is an indication that there may be price reversal ahead shortly. However, when divergences occur across multiple timeframes, it provides stronger support to the theory that a price reversal may be ahead. In addition, when you add in other technical indicators, such as the 61.8% Fibonacci retracement level, the horizontal support, and the gap fill on the weekly, it provides a stronger narrative due to a confluence of supports.
Will EUR/CHF reverse here? Nothing is certain. But the idea is to try and determine a confluence of many indicators (both technical and fundamental). This will increase the odds of the trade working out in your favor. When there are diverging RSIs with price, across multiple timeframes, odds increase of a reversal in price.
Yes, it’s true the EUR/USD has had six straight down days entering today. However, just because the EUR/USD has been moving lower lately, it does not justify the move lower in EUR/CHF, which has been moving lower since late October! But is it time for the pair to bounce? When we look at the EUR/CHF across multiple timeframes, they all seem to have one thing in common, the RSI is diverging with price!
According to Investopedia, the Relative Strength Index (RSI) is a momentum indicator that measures the magnitude of recent price changes to evaluate overbought or oversold conditions in the prices of a stock or other asset. The RSI is displayed as an oscillator and can have a reading from 0 to 100. An RSI with a value above 70 is considered overbought and a reading of below 30 indicates oversold. A bullish divergence occurs when the RSI creates an oversold reading followed by a higher low that matches correspondingly lower lows in price. A bearish divergence occurs when the RSI creates an overbought reading, followed by a lower high that matches correspondingly higher highs in price.
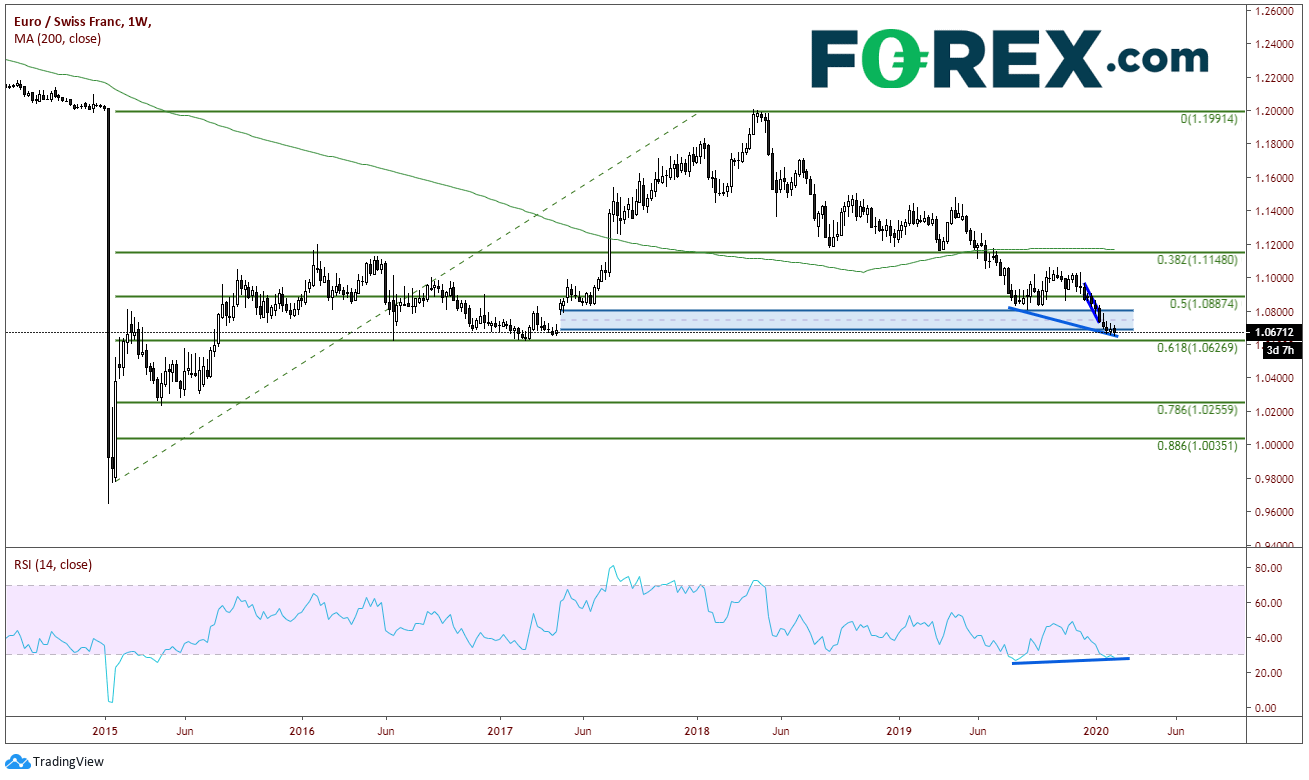
On a weekly timeframe, EUR/CHF has been moving lower in earnest since mid-May 2018. Price is currently at 1.0670, very close to the 61.8% retracement level from the January 2015 lows (when the SNB pulled the 1.2000 EUR/CHF peg) to the May 2018 highs, which also represents horizontal support. Price has filled the gap from mid-April 2017. Notice how the RSI is diverging from price. Price is making a lower low and the RSI is making a higher low, which is a bullish divergence:
Source: Tradingview, FOREX.com
On a daily timeframe, one only needs to go back to January 24th to see the divergence. Price is putting in lower lows as the RSI is putting in higher lows (a bullish divergence):
Source: Tradingview, FOREX.com
Even on a 240-minute timeframe, one only needs to go back to January 28th to see that the RSI and price are diverging (bullish divergence):
Source: Tradingview, FOREX.com
What does it mean when price is diverging with the RSI? This is an indication that there may be price reversal ahead shortly. However, when divergences occur across multiple timeframes, it provides stronger support to the theory that a price reversal may be ahead. In addition, when you add in other technical indicators, such as the 61.8% Fibonacci retracement level, the horizontal support, and the gap fill on the weekly, it provides a stronger narrative due to a confluence of supports.
Will EUR/CHF reverse here? Nothing is certain. But the idea is to try and determine a confluence of many indicators (both technical and fundamental). This will increase the odds of the trade working out in your favor. When there are diverging RSIs with price, across multiple timeframes, odds increase of a reversal in price.
Related tags:
Latest market news



The complete CFD trading experience
Award-winning platforms, competitive spreads, low commissions and dedicated support.
We live and breathe the markets and are dedicated to helping traders realise their ambitions as we continue to set the industry bar.
Economic calendar
Web Trader platform
Our sophisticated web-based platform is packed with features.
Related articles
EUR/USD weekly outlook: Oil, inflation and NFP in focus
After coming under significant pressure in recent weeks, the EUR/USD came off its lows to finish the week on a positive note on Friday, albeit with only a mild rebound. That was not enough to prevent the exchange rate falling for the third consecutive week, as the US dollar and bond yields rallied across the board.

EUR/USD Q4 2026 Outlook: Euro at a Crossroads as Fed, ECB Tighten 9 25 2026
EUR/USD enters Q4 at a pivotal inflection point as competing Fed-ECB policy paths and persistent inflation risks collide with major technical support.


USD/JPY Q4 2026 Outlook: Hawkish Fed Pricing Clashes With Intervention Risk
The year-end tug-of-war is clear: hawkish Fed pricing supports USD/JPY, while intervention risk limits the upside.

StoneX Europe Ltd may make third party material available on this website which may contain information included but not limited to the conditions of financial markets. The material is for information purposes only and does not contain, and should not be construed as containing, investment advice and/or investment recommendation and/or an investment research and/or an offer of or solicitation for any transactions in financial instruments; any decision to enter into a specific transaction shall be made by the client following an assessment by him/her of their situation.
StoneX Europe Ltd makes no representation or warranty and assumes no liability as to the accuracy or completeness of the information provided, nor any loss arising from any investment based on a recommendation, forecast or other information supplied. You should always seek independent advice as to your suitability to speculate in any related markets and your ability to assume the associated risks, if you are at all unsure. We are not under any obligation to update any such material. Any opinion made may be personal to the author and may not reflect the opinion of StoneX Europe Ltd.