




European Open: EUR/GBP stays within range ahead of UK data dump
EUR/GBP finds itself at an interesting juncture, as a break out of its current range could mark its next directional move.
Share this:

Asian Indices:
- Australia's ASX 200 index fell by -53.5 points (-0.76%) and currently trades at 7,017.50
- Japan's Nikkei 225 index has risen by 685.11 points (2.46%) and currently trades at 28,504.44
- Hong Kong's Hang Seng index has risen by 64.5 points (0.32%) and currently trades at 20,146.93
- China's A50 Index has fallen by -24.93 points (-0.18%) and currently trades at 13,637.90
UK and Europe:
- UK's FTSE 100 futures are currently down -1.5 points (-0.02%), the cash market is currently estimated to open at 7,464.41
- Euro STOXX 50 futures are currently down -4 points (-0.11%), the cash market is currently estimated to open at 3,753.05
- Germany's DAX futures are currently down -16 points (-0.12%), the cash market is currently estimated to open at 13,678.51
US Futures:
- DJI futures are currently up 44 points (0.13%)
- S&P 500 futures are currently up 34.25 points (0.26%)
- Nasdaq 100 futures are currently up 7.25 points (0.17%)

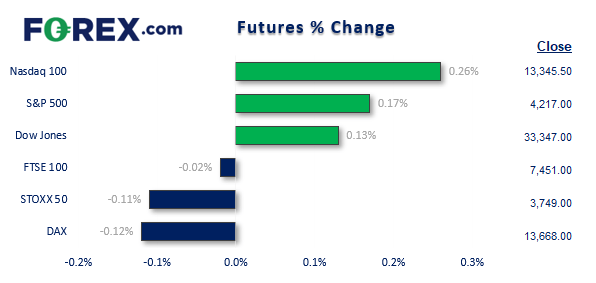
Despite softer inflation in the US, Fed members are continuing to talk a hawkish game and that has weighed on sentiment for equity traders. Wall Street stumbled overnight and the ASX 200 followed its lead today, finding resistance at its 200-day exponential moving average. But we’ve also reached that that stage of the year where price action is choppy and its direction can be fickle. Conversely, traders in Japan wasted no time in celebrating soft US inflation as they sent the Nikkei to its highest levels since January. The exchange was closed yesterday due to a public holiday.
With US inflation data now behind us, it is almost like the calm after the storm. And that has led to tight ranges for currencies and commodities after a spell of volatility a couple of days ago. With $1800 being such a nice round number it is a tempting level for traders to book a profit after its rally from the July low. Gold is on track for its fourth consecutive bullish week, and that has placed us on guard for some mean reversion below $1800.
EUR/GBP daily chart:
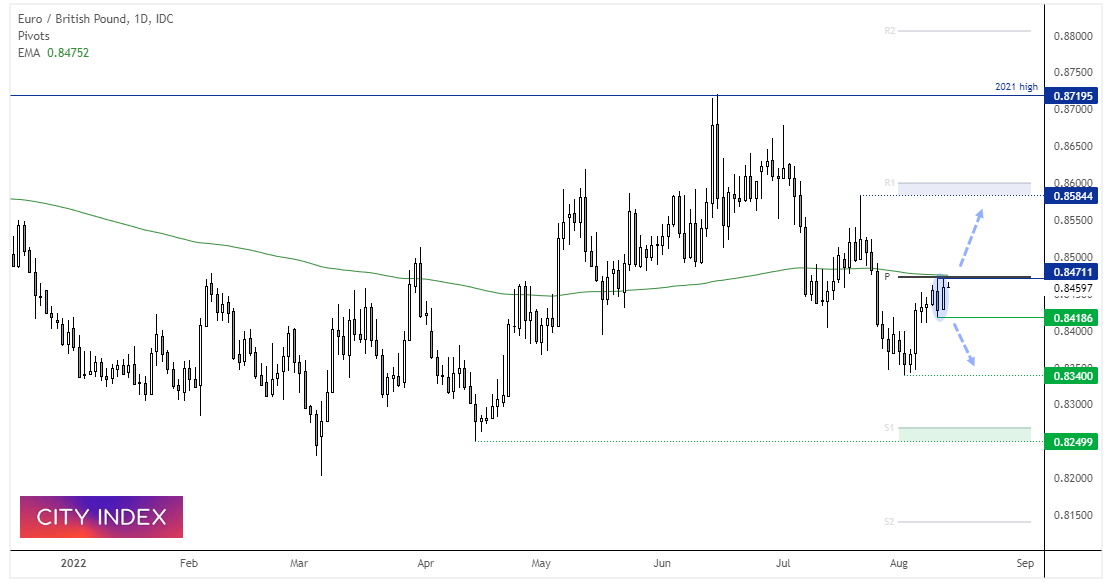

EUR/GBP is trading an approximate 50-pip range and its next directional move could be marked by which side of the range it breaks. A series of lower lows and highs has formed on the daily chart, although its recent countertrend move has met resistance at the 200-day eMA and monthly pivot point. A bearish engulfing candle also formed on Wednesday below resistance, so a break beneath 0.8418 assumes a swing high has formed. However, should we see a break above the 200-day eMA, we will switch to a bullish bias.
FTSE 350 – Market Internals:


FTSE 350: 4164.99 (-0.55%) 11 August 2022
- 140 (40.00%) stocks advanced and 201 (57.43%) declined
- 8 stocks rose to a new 52-week high, 3 fell to new lows
- 35.71% of stocks closed above their 200-day average
- 89.43% of stocks closed above their 50-day average
- 16.86% of stocks closed above their 20-day average
Outperformers:
- + 16.18% - Network International Holdings PLC (NETW.L)
- + 8.12% - Aston Martin Lagonda Global Holdings PLC (AML.L)
- + 5.78% - Harbour Energy PLC (HBR.L)
Underperformers:
- -10.06% - GSK plc (GSK.L)
- -8.63% - Savills PLC (SVS.L)
- -6.35% - Jupiter Fund Management PLC (JUP.L)
Economic events up next (Times in BST)
A data dump for the UK arrives at 07:00 – where any signs of weakness on the data simply backs up the BOE’s warnings of a 5-quarter recession. GDP, output for industrial, manufacturing and construction and business investment will all be in focus. But with expectations on the grim side it also allows for a positive surprise, should data not be as catastrophic as feared.
US import prices also warrants a look, as it is one of the (many) key inputs to consumer inflation. After hitting an 11-year high of 13.01% in March, import prices have declined for the past three months and now sit at 10.6%.
The University of Michigan also release their preliminary consumer survey at 13:30 BST. It saw a minor increase last month, but from a record low.
How to trade with City Index
You can easily trade with City Index by using these four easy steps:
- Open an account, or log in if you’re already a customer
• Open an account in the UK
• Open an account in Australia
• Open an account in Singapore
- Search for the company you want to trade in our award-winning platform
- Choose your position and size, and your stop and limit levels
- Place the trade
How to trade with FOREX.com
Follow these easy steps to start trading with FOREX.com today:
- Open a Forex.com account, or log in if you’re already a customer.
- Search for the pair you want to trade in our award-winning platform.
- Choose your position and size, and your stop and limit levels.
- Place the trade.
Related tags:
Latest market news




The complete CFD trading experience
Award-winning platforms, competitive spreads, low commissions and dedicated support.
We live and breathe the markets and are dedicated to helping traders realise their ambitions as we continue to set the industry bar.
Economic calendar
Web Trader platform
Our sophisticated web-based platform is packed with features.
Related articles
S&P 500, Nasdaq, Dow Forecast: Wall Street Split Widens Into Month-End 9 26 2026
Nasdaq strength contrasts with mounting Dow pressure as rising Treasury yields raise the stakes for stocks heading into the monthly close.

EUR/USD weekly outlook: Oil, inflation and NFP in focus
After coming under significant pressure in recent weeks, the EUR/USD came off its lows to finish the week on a positive note on Friday, albeit with only a mild rebound. That was not enough to prevent the exchange rate falling for the third consecutive week, as the US dollar and bond yields rallied across the board.


USD/JPY Weekly Outlook: Payrolls loom as US rates remain the dominant driver
Strong US growth and hawkish Fed pricing continue to support USD/JPY, while intervention risk appears to be kicking in at lower levels

StoneX Europe Ltd may make third party material available on this website which may contain information included but not limited to the conditions of financial markets. The material is for information purposes only and does not contain, and should not be construed as containing, investment advice and/or investment recommendation and/or an investment research and/or an offer of or solicitation for any transactions in financial instruments; any decision to enter into a specific transaction shall be made by the client following an assessment by him/her of their situation.
StoneX Europe Ltd makes no representation or warranty and assumes no liability as to the accuracy or completeness of the information provided, nor any loss arising from any investment based on a recommendation, forecast or other information supplied. You should always seek independent advice as to your suitability to speculate in any related markets and your ability to assume the associated risks, if you are at all unsure. We are not under any obligation to update any such material. Any opinion made may be personal to the author and may not reflect the opinion of StoneX Europe Ltd.