




European Open: Has gold finally found a floor?
We warned of potential support in yesterday’s gold wrap report, and price action since appears promising that a swing low is in the making – at least over the near-term.
Share this:

Asian Indices:
- Australia's ASX 200 index fell by -8.2 points (-0.12%) and currently trades at 6,786.10
- Japan's Nikkei 225 index has risen by 128.35 points (0.46%) and currently trades at 27,931.35
- Hong Kong's Hang Seng index has risen by 14.75 points (0.07%) and currently trades at 20,589.38
- China's A50 Index has risen by 33.37 points (0.24%) and currently trades at 14,007.50
UK and Europe:
- UK's FTSE 100 futures are currently up 14 points (0.19%), the cash market is currently estimated to open at 7,284.51
- Euro STOXX 50 futures are currently down -5 points (-0.14%), the cash market is currently estimated to open at 3,591.51
- Germany's DAX futures are currently down -27 points (-0.2%), the cash market is currently estimated to open at 13,219.64
US Futures:
- DJI futures are currently down -60 points (-0.19%)
- S&P 500 futures are currently down -109 points (-0.86%)
- Nasdaq 100 futures are currently down -18.75 points (-0.47%)
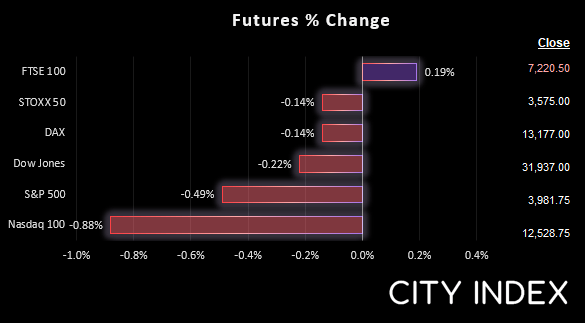
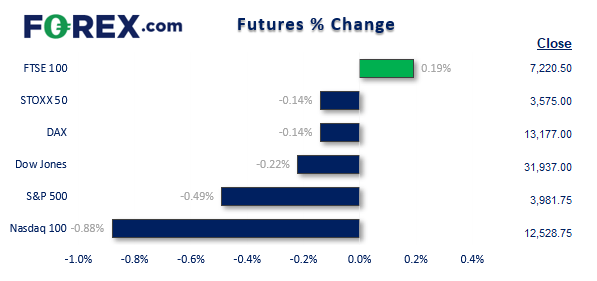
China’s share markets slipped on Friday due to reports of another outbreak in the region. The Nikkei is on track for its best week in four months, with growth stocks and shipping firms taking the lead. US futures have opened lower, roughly taking around half of yesterday’s gains away. European bourses are also lower, although the FTSE has bucked the trend and trades 0.2% higher from yesterday’s close.
Oil prices made minor gains overnight, but it appears more likely that the markets printed a swing high on Tuesday and could be set to fall further over the near-term. A stronger US dollar would clearly help with that outlook, so on that front it is encouraging to see the US dollar index has found support at the 20-day eMA and be may forming a swing low.
Gold daily chart:


Gold remains within an established bearish channel, although recent price action suggests an important swing low has formed. Yesterday’s low held above the August 2021 low (with the March 2021 low ~$5 beneath it). We highlighted the importance of these lows in yesterday’s Gold Wrap report. A bullish engulfing pattern has formed on the daily chart and tested a 4-day high, and provides a bullish bias over the near-term and potential for a rally to $1750 resistance. Retracements towards the $1700 / monthly S3 pivot would be desirable to increase the potential reward to rise ratio, otherwise a direct break of yesterday’s high assumes bullish continuation.
FTSE 350 – Market Internals:
The FTSE 100 was one of the few major indices to not break to new cycle highs yesterday, which is a sign of weakness on a relative basis. In theory this keeps the FTSE as a potential short candidate should sentiment turn lower. Support was found at the 20-day eMA after a weak start and a bullish pinbar formed on the daily chart, but the bias remains bearish beneath Wednesday’s high (or the 7362.37 high for extra comfort) in line with the analysis from yesterday’s European open.


FTSE 350: 4055.79 (0.09%) 20 July 2022
- 281 (80.06%) stocks advanced and 65 (18.52%) declined
- 5 stocks rose to a new 52-week high, 0 fell to new lows
- 25.93% of stocks closed above their 200-day average
- 76.07% of stocks closed above their 50-day average
- 17.95% of stocks closed above their 20-day average
Outperformers:
- + 26.60% - Frasers Group PLC (FRAS.L)
- + 12.86% - Moneysupermarket.Com Group PLC (MONY.L)
- + 10.05% - IG Group Holdings PLC (IGG.L)
Underperformers:
- -9.44% - Carnival PLC (CCL.L)
- -5.65% - Harbour Energy PLC (HBR.L)
- -3.84% - Wizz Air Holdings PLC (WIZZ.L)
Economic events up next (Times in BST)
How to trade with City Index
You can easily trade with City Index by using these four easy steps:
- Open an account, or log in if you’re already a customer
• Open an account in the UK
• Open an account in Australia
• Open an account in Singapore
- Search for the company you want to trade in our award-winning platform
- Choose your position and size, and your stop and limit levels
- Place the trade
How to trade with FOREX.com
Follow these easy steps to start trading with FOREX.com today:
- Open a Forex.com account, or log in if you’re already a customer.
- Search for the pair you want to trade in our award-winning platform.
- Choose your position and size, and your stop and limit levels.
- Place the trade.
Related tags:
Latest market news




The complete CFD trading experience
Award-winning platforms, competitive spreads, low commissions and dedicated support.
We live and breathe the markets and are dedicated to helping traders realise their ambitions as we continue to set the industry bar.
Economic calendar
Web Trader platform
Our sophisticated web-based platform is packed with features.
Related articles
S&P 500, Nasdaq, Dow Forecast: Wall Street Split Widens Into Month-End 9 26 2026
Nasdaq strength contrasts with mounting Dow pressure as rising Treasury yields raise the stakes for stocks heading into the monthly close.

EUR/USD weekly outlook: Oil, inflation and NFP in focus
After coming under significant pressure in recent weeks, the EUR/USD came off its lows to finish the week on a positive note on Friday, albeit with only a mild rebound. That was not enough to prevent the exchange rate falling for the third consecutive week, as the US dollar and bond yields rallied across the board.

Gold Price Forecast: XAU/USD Avoids Breakdown as Yields Surged but Can it Continue?
Surging Treasury yields sent a jolt across markets last week but, so far, gold prices have held above the FOMC low. The big question now is whether that can continue and, if not, will bulls show up at $4100 or $4k like they did in June and July?

StoneX Europe Ltd may make third party material available on this website which may contain information included but not limited to the conditions of financial markets. The material is for information purposes only and does not contain, and should not be construed as containing, investment advice and/or investment recommendation and/or an investment research and/or an offer of or solicitation for any transactions in financial instruments; any decision to enter into a specific transaction shall be made by the client following an assessment by him/her of their situation.
StoneX Europe Ltd makes no representation or warranty and assumes no liability as to the accuracy or completeness of the information provided, nor any loss arising from any investment based on a recommendation, forecast or other information supplied. You should always seek independent advice as to your suitability to speculate in any related markets and your ability to assume the associated risks, if you are at all unsure. We are not under any obligation to update any such material. Any opinion made may be personal to the author and may not reflect the opinion of StoneX Europe Ltd.