


EUR/USD, Oil Forecast: Two Trades to Watch
EUR/USD holds above 1.12 but lacks conviction. Oil holds above 75.00 but struggles for direction.
Share this:

EUR/USD holds above 1.12 but lacks momentum
- German PPI cools to 0.1% YoY
- Eurozone consumer confidence is due to rise to -16 from -16.1
- EUR/USD holds above 1.12 but gains lack drive
EUR/USD is edging higher on Thursday but the move higher lacks drive, despite a weaker U.S. dollar and as investors digest the latest German PPI inflation data.
EURUSD is broadly being supported by expectations that the Federal Reserve is close to the end of its rate hiking cycle whilst the ECB is expected to continue raising interest rates potentially for a few more meetings.
Data yesterday showed that core inflation in the eurozone was upwardly revised to 5.5% YoY in June, up from 5.3% in May. At the same time, headline inflation cooled from 6.1% to 5.5%.
Today German PPI cooled to 0.1% YoY in June, down from 1% but slightly above the 0% forecast. On a monthly basis, German PPI fell -0.3%, suggesting that inflationary pressure could be lessening.
While the central bank is expected to raise interest rates next week, there are some questions over what will happen in September. ECB policymaker Klass Knot said earlier this week that there are no guarantees about what could happen at meetings after July. Should investors rein in September rate hike bets, the euro could struggle to push much higher.
Looking ahead, attention now turns to the eurozone consumer confidence, which is expected to improve very slightly two - 16 from - 16.1 in June.
Meanwhile, the USD is on the back foot once again after yesterday’s softer housing data supports the view that the Fed could hike rates just once more this year.
US jobless claims and the Philly Fed manufacturing index could influence the greenback.
EUR/USD forecast - technical analysis
EUR/USD broke out of a symmetrical triangle before running into resistance at 1.1275 and has since eased back towards 1.12. The RSI is still in overbought territory, so buyers should be cautious.
A rise above 1.1275, could bring 1.13 round number into play ahead of 1.1375, the late February high.
Meanwhile, sellers could look for a break below 1.1175, the weekly low, to extend losses towards 1.1090 the May high.


Oil holds above 75.00 but struggles for direction
- US recession fears ease but China’s demand outlook is mixed
- EIA stockpile draw 708k vs 2.4 million forecast
- Oil gains are capped by the falling trendline resistance
oil prices are holding steady around 75.00 amid a smaller-than-expected draw in US stockpiles, a potentially weaker demand outlook, and a weaker USD.
Oil prices fell yesterday after EIA data showed that US oil inventories fell by 708k barrels in the week ending July 14, well short of the 2.4-million-barrel draw expected. US gasoline saw a notable decline in demand.
The demand outlook for the US could be improving. The market is increasingly confidence that the Federal Reserve is close to the end of its hiking cycle. Meanwhile, US economic data is showing that the economy remains resilient. As a result, expectations of a U S recession ING happening in the next 12 months appear to be falling. Goldman Sachs is just the latest investment bank to revise down the odds over US recession. Analysts at the investment bank now see the chances of a US recession at 20% down from 25%
Meanwhile, the demand picture in China, the world's largest importer of oil, is mixed amid its slowing economy but high oil import figures.
Given that the oil demand outlook is so mixed, oil could struggle to find a clear direction from here.
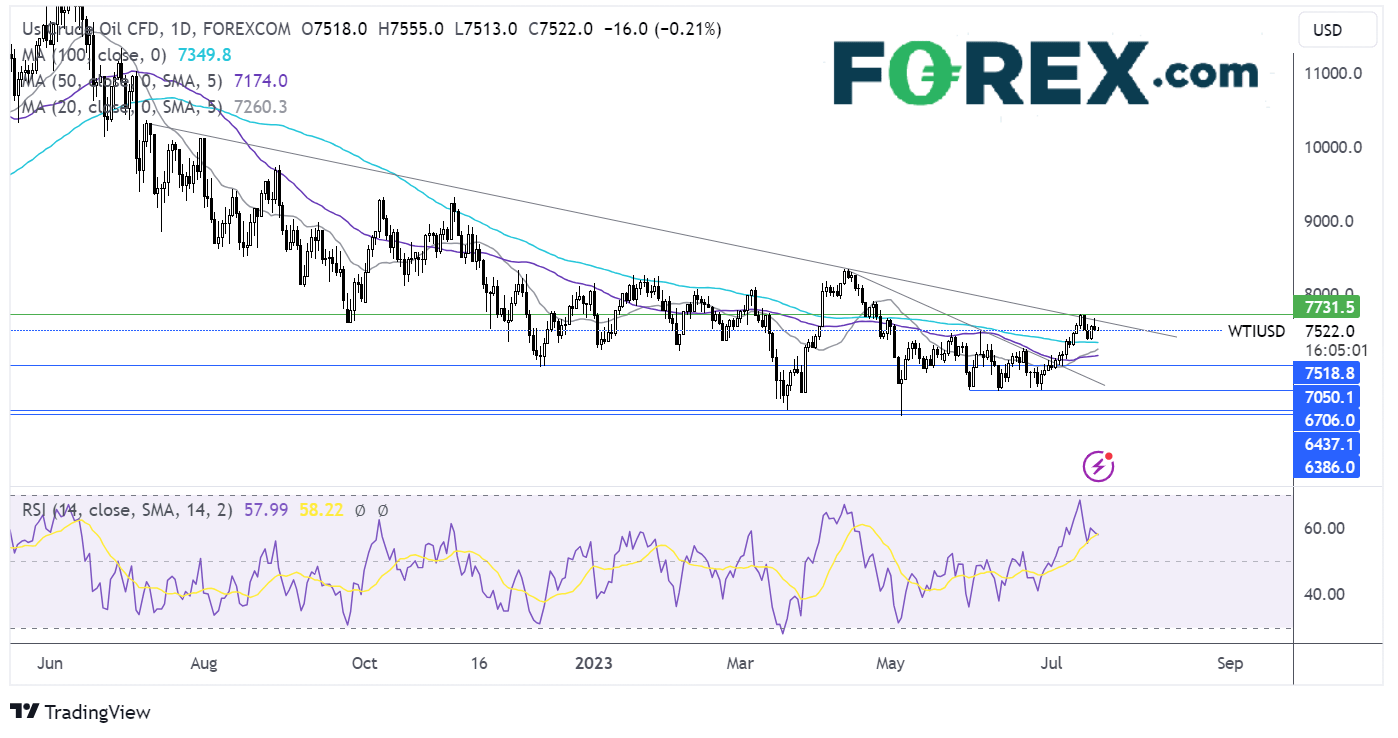
Oil forecast – technical analysis
Any moves higher in oil are still being capped by the multi-month falling trendline. Buyers need to rise above 76.85, the falling trendline resistance and yesterday’s high and 77.20 the July high, to extend the near-term bull rebound from the 67.00 low.
Meanwhile, sellers could look for a break below 75.00, the June high, to test support of the 100 sma at 73.50 to creare a lower low and expose the 20 sma at 72.60. A break below 70.50 could see the bears pick up pace.

Related tags:



The complete CFD trading experience
Award-winning platforms, competitive spreads, low commissions and dedicated support.
We live and breathe the markets and are dedicated to helping traders realise their ambitions as we continue to set the industry bar.
Economic calendar
Web Trader platform
Our sophisticated web-based platform is packed with features.
Related articles

Nikkei breakout accelerates as yen weakness returns
Nikkei has started October with a powerful breakout, helped by renewed yen weakness and strong upside momentum


EUR/USD Forecast: Euro Struggles to Find Support Even After U.S. PCE Data
The euro continues to face a challenging environment in the short term. The currency has struggled to regain ground against a U.S. dollar that remains firmly supported, a dynamic reflected in EUR/USD, which has now recorded three consecutive losing sessions and a decline of roughly 0.6%.


The RBA Hiked Rates and the Australian Dollar Still Fell
AUD/USD fell after the RBA rate hike because the central bank's hawkish stance was already priced in while the U.S. dollar stayed firm.

StoneX Europe Ltd may make third party material available on this website which may contain information included but not limited to the conditions of financial markets. The material is for information purposes only and does not contain, and should not be construed as containing, investment advice and/or investment recommendation and/or an investment research and/or an offer of or solicitation for any transactions in financial instruments; any decision to enter into a specific transaction shall be made by the client following an assessment by him/her of their situation.
StoneX Europe Ltd makes no representation or warranty and assumes no liability as to the accuracy or completeness of the information provided, nor any loss arising from any investment based on a recommendation, forecast or other information supplied. You should always seek independent advice as to your suitability to speculate in any related markets and your ability to assume the associated risks, if you are at all unsure. We are not under any obligation to update any such material. Any opinion made may be personal to the author and may not reflect the opinion of StoneX Europe Ltd.