



EURUSD Tests 1.17 as DXY Dips to 98 — Breakout or Range?
As tariff risks and negotiations evolve, the latest moves in EURUSD and the DXY have established notable resistance and support zones near 1.17 and 98, respectively. This raises the possibility of an extended range before a confirmed breakout.
Share this:

Key Events:
- Reciprocal tariffs have commenced, with steeper tariffs under negotiation
- DXY holds above the 98 support ahead of the U.S. market open
- EURUSD remains below the 1.17 resistance ahead of the U.S. market open
With Nasdaq back near record highs at 23,500 and Bitcoin trading above 116,000, risk appetite appears to be re-emerging. However, gold prices are still hovering just below the 3,400 mark.
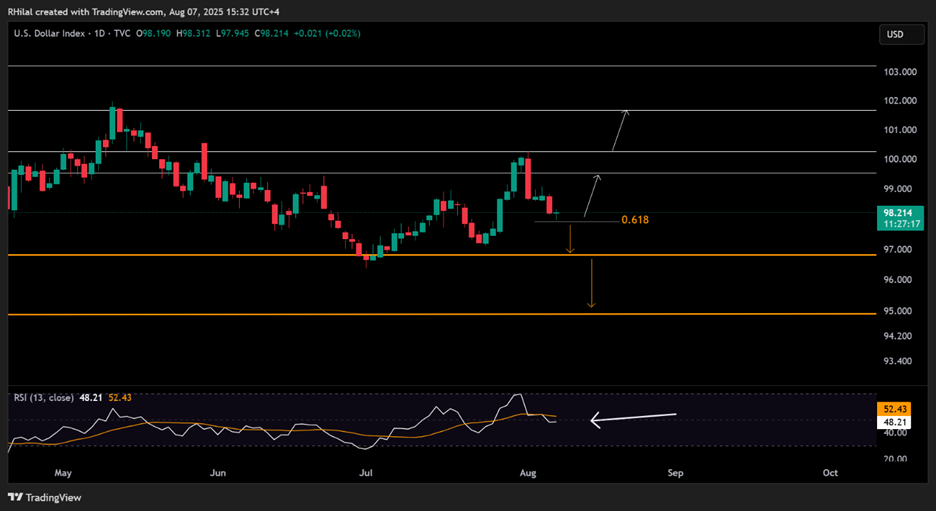
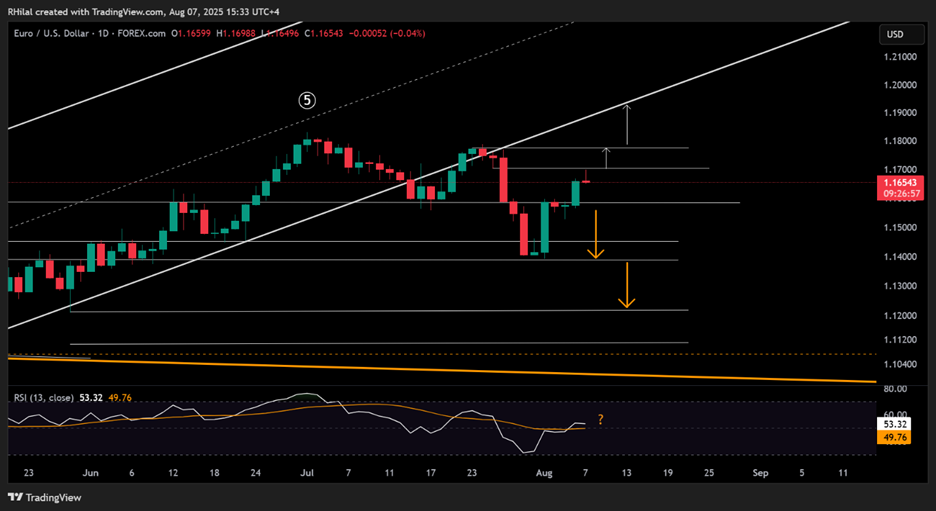
As for currencies, the DXY has dropped toward the 0.618 Fibonacci retracement of the broader rally from 96 to 100. EURUSD, in turn, pulled back slightly from the 1.1680–1.17 resistance zone.
Trump's tariffs took effect at midnight, targeting over 60 countries including the EU. More aggressive tariffs have been imposed on countries such as India, the EU, Taiwan, Japan, and South Korea, aiming to reduce the U.S. budget deficit and support domestic manufacturing. In connection with Russian oil imports, both India and China may face tariffs exceeding 40% by the end of August if they continue their imports. This may shift focus toward potential bloc retaliation against the U.S., particularly through BRICS strategic moves to reduce reliance on U.S. markets.
Uncertainty around gold’s bullish hold is justified, while Nasdaq’s surge requires confirmation above the 23,700 resistance. Similarly, EURUSD’s advance hinges on a confirmed breakout above 1.17, and DXY weakness must be validated with a clear break below the 98 level.
Technical Analysis: Quantifying Uncertainties
DXY Outlook: Daily Time Frame – Log Scale
Source: Tradingview
Beyond the bearish headlines, the DXY has retraced to the 0.618 Fibonacci level from the three-legged rebound between 96 and 100.20, suggesting a possible hold above 98 that could trigger a recovery toward 99.45 and 100.20. If a clear breakout above 100.20 occurs, a stronger uptrend may unfold targeting 101.70, 103.00, and 105.00.
On the downside, a confirmed close below 98 may lead to extended losses toward 97 and 96. A steeper decline toward 94 and 89 is also possible, likely strengthening EURUSD and GBPUSD toward their 2021 peaks.
EURUSD Outlook: Daily Time Frame - Log Scale
Source: Tradingview
EURUSD surged toward the 1.17 resistance amid dollar weakness, with a daily RSI breakout above the 50-neutral level supporting bullish momentum. For a sustained bullish forecast, I’d like to see a clean hold above 1.17 and 1.18, which could extend gains toward 1.20 and 1.23 — aligning with the 2021 highs.
On the downside, if the pair prepares for another dip, a clean hold below 1.16 may extend losses toward 1.1520 and 1.1450, with the potential for a deeper drop toward 1.12 and 1.11.
Written by Razan Hilal, CMT
Follow on X: @Rh_waves
Related tags:
Latest market news



The complete CFD trading experience
Award-winning platforms, competitive spreads, low commissions and dedicated support.
We live and breathe the markets and are dedicated to helping traders realise their ambitions as we continue to set the industry bar.
Economic calendar
Web Trader platform
Our sophisticated web-based platform is packed with features.
Related articles
EUR/USD weekly outlook: Oil, inflation and NFP in focus
After coming under significant pressure in recent weeks, the EUR/USD came off its lows to finish the week on a positive note on Friday, albeit with only a mild rebound. That was not enough to prevent the exchange rate falling for the third consecutive week, as the US dollar and bond yields rallied across the board.

EUR/USD Q4 2026 Outlook: Euro at a Crossroads as Fed, ECB Tighten 9 25 2026
EUR/USD enters Q4 at a pivotal inflection point as competing Fed-ECB policy paths and persistent inflation risks collide with major technical support.


USD/JPY Q4 2026 Outlook: Hawkish Fed Pricing Clashes With Intervention Risk
The year-end tug-of-war is clear: hawkish Fed pricing supports USD/JPY, while intervention risk limits the upside.

StoneX Europe Ltd may make third party material available on this website which may contain information included but not limited to the conditions of financial markets. The material is for information purposes only and does not contain, and should not be construed as containing, investment advice and/or investment recommendation and/or an investment research and/or an offer of or solicitation for any transactions in financial instruments; any decision to enter into a specific transaction shall be made by the client following an assessment by him/her of their situation.
StoneX Europe Ltd makes no representation or warranty and assumes no liability as to the accuracy or completeness of the information provided, nor any loss arising from any investment based on a recommendation, forecast or other information supplied. You should always seek independent advice as to your suitability to speculate in any related markets and your ability to assume the associated risks, if you are at all unsure. We are not under any obligation to update any such material. Any opinion made may be personal to the author and may not reflect the opinion of StoneX Europe Ltd.