




GBP/USD, GBP/AUD: British pound breaking down on multiple fronts
GBP/USD has looked healthier on the charts, closing below a key support zone on Thursday. Downside risks for GBP/AUD are also growing.
Share this:

The British pound has looked healthier on the charts, closing below a key support zone on Thursday, signaling the potential for weakness to intensify ahead. And that’s before we even get to deteriorating fundamentals.
GBP/USD looks terrible on the charts
Technically, GBP/USD looks terrible. It’s broken key support at 1.2450 and the 200-day MA, closing at the lowest level since June. Given the significance of this zone, the case for further downside is strong, pointing to a likely test of 1.2300, the intersection of the 50% retracement of the 2021-2022 high-low and the lower bound of the downtrend it’s been stuck in sine July. Below that, there’s not a lot of support until you get to 1.1840, the 38.2% Fibonacci retracement of the 2021-2022 high-low. A stop above 1.2450 will help to limit losses should the break prove to be a head fake. RSI is approaching oversold levels, so that’s one indicator to keep an eye on.
Fundamentals add to GBP downside risks
Fundamentally, it’s easy to see why downside risks are growing for the pound. The US economy is looking more than resilient, destroying recession forecast after recession forecast, largely because of ongoing strength in the labour market.
Contrast that to what’s going on in Europe where stagflation risks look to be building. The ECB said it was done hiking rates on Thursday, pointing to the risk the Bank of England does the same next week given similarities in economic conditions to those seen on the continent. It’s like chalk and cheese. The US dollar is a beacon of light in an otherwise gloomy G10 FX forest.
GBP/AUD breaks uptrend in dramatic fashion
The buck is not the only currency GBP is looking vulnerable against. Take the Australian dollar, for example. It’s been the whipping boy of currency markets for months, used as a proxy to express pessimism towards what’s happening in China. But with sentiment and expectations towards China already so low, and with authorities already acting to stabilise economic activity, the directional risks for AUD are now arguably to the upside.
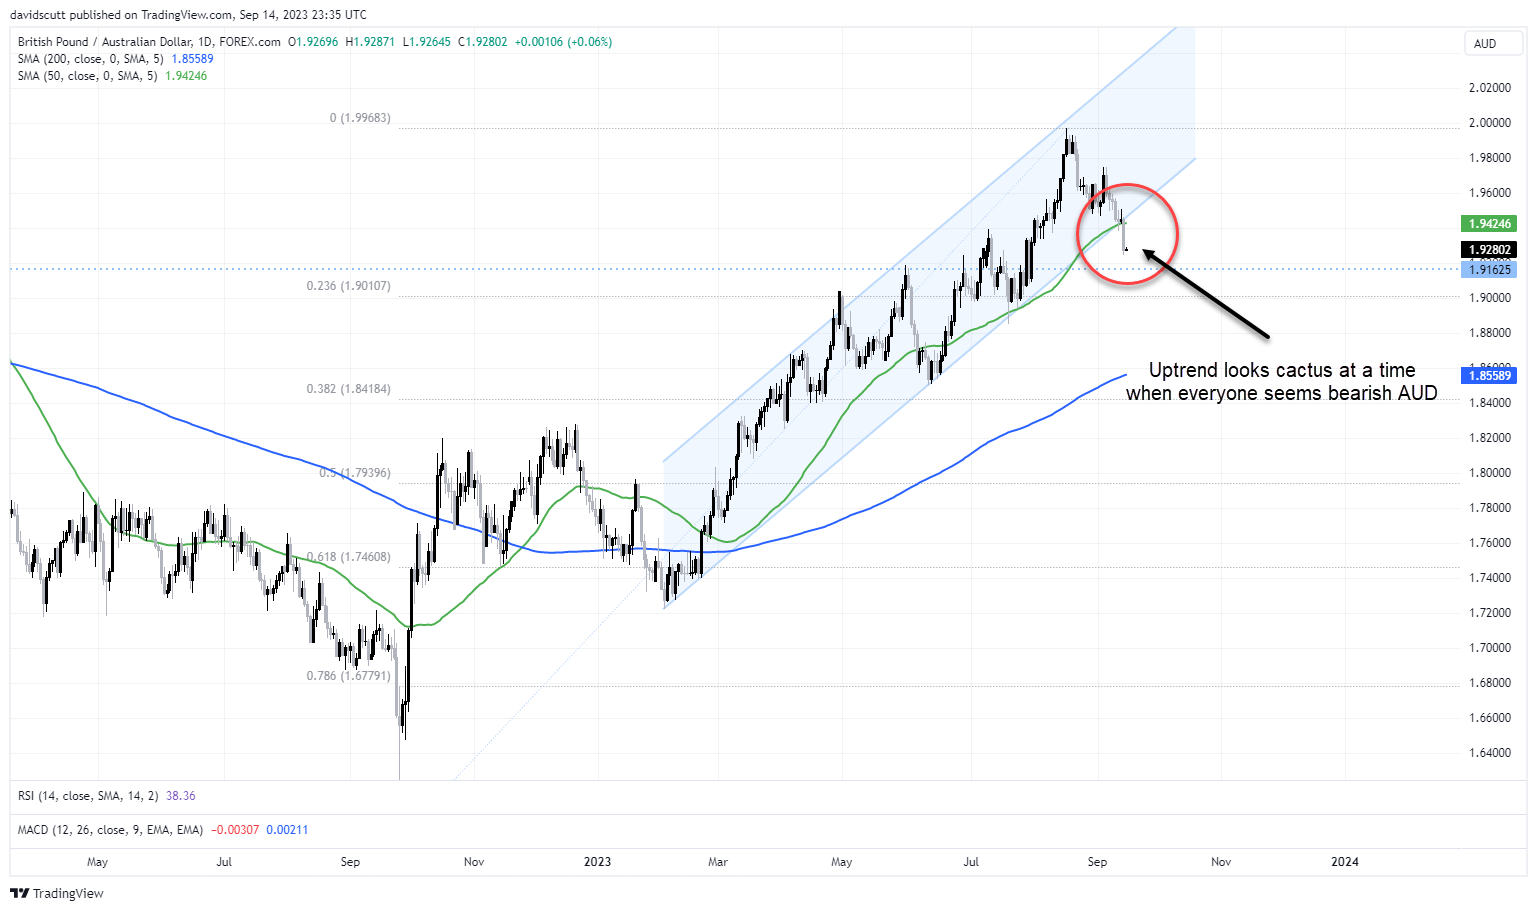
Look at the GBP/AUD daily chart. It’s broken out of the uptrend that began earlier this year when China reopening optimism started to wane. It’s also cut through the 50-day MA like a hot knife through butter, a level it’s respected numerous times in the recent past. Talk about potential downside risks!
Support located above 1.9150 is the first port of call on the downside. Beyond that, the Fib retracement at 1.9000 looms large.
-- Written by David Scutt
Follow David on Twitter @scutty
How to trade with City Index
You can trade with City Index by following these four easy steps:
- Open an account, or log in if you’re already a customer
• Open an account in the UK
• Open an account in Australia
• Open an account in Singapore
- Search for the market you want to trade in our award-winning platform
- Choose your position and size, and your stop and limit levels
- Place the trade
Latest market news




The complete CFD trading experience
Award-winning platforms, competitive spreads, low commissions and dedicated support.
We live and breathe the markets and are dedicated to helping traders realise their ambitions as we continue to set the industry bar.
Economic calendar
Web Trader platform
Our sophisticated web-based platform is packed with features.
Related articles

USD/MXN Forecast: Peso Loses Momentum Ahead of Banxico Decision
Over recent trading sessions, the Mexican peso has started to show signs of losing strength against the U.S. dollar. This can be seen in the performance of USD/MXN, which has gained more than 1.7% over the last three sessions, highlighting the dollar's renewed strength against the peso.


US Dollar Price Action Setups: USD/JPY, USD/CAD, EUR/USD, GBP/USD, Gold
The US Dollar has rallied since last week’s rate hike and USD/JPY remains a massive driver across the USD complex.


USD/CAD Analysis: Is the Canadian Dollar Running Out of Support?
A new trading week is underway, and the Canadian dollar continues to show signs of weakening momentum. This can be seen in recent USD/CAD price action, with the pair gaining nearly 0.7% over the last four trading sessions.
StoneX Europe Ltd may make third party material available on this website which may contain information included but not limited to the conditions of financial markets. The material is for information purposes only and does not contain, and should not be construed as containing, investment advice and/or investment recommendation and/or an investment research and/or an offer of or solicitation for any transactions in financial instruments; any decision to enter into a specific transaction shall be made by the client following an assessment by him/her of their situation.
StoneX Europe Ltd makes no representation or warranty and assumes no liability as to the accuracy or completeness of the information provided, nor any loss arising from any investment based on a recommendation, forecast or other information supplied. You should always seek independent advice as to your suitability to speculate in any related markets and your ability to assume the associated risks, if you are at all unsure. We are not under any obligation to update any such material. Any opinion made may be personal to the author and may not reflect the opinion of StoneX Europe Ltd.