



Gold Analysis: Gold Reverses off Record Highs, Will We See 2K Next?
After reversing from record highs, could Gold be vulnerable to a deeper pullback?
Share this:

Gold Key Points
- The bullish case for gold hinges on expectations for a global central bank “pivot” to interest rate cuts early next year.
- After a big dovish shift in market expectations last week, there’s potential for the pendulum to swing back toward a more balanced outlook for central banks.
- A break below last Thursday’s low and the near-term bullish channel in the $2030 zone could open the door for a deeper pullback toward $2000.
Gold Fundamental Analysis
If I described the current market environment, with a weakening US dollar, falling yields, geopolitical tensions, and an historically strong season period for gold, you probably wouldn’t be surprised to hear that the yellow metal is rallying.
However, if I told you that gold spiked roughly 3.5% in less than an hour to hit record highs in low liquidity Asian session trade, you’d probably be a bit skeptical of the move.
As it turns out, all of the above statements are true... and the market clearly expressed skepticism with today’s early spike as gold is now trading lower on the day.
Outside of unpredictable geopolitical developments, the bullish case for gold hinges on expectations for a global central bank “pivot” to interest rate cuts early next year, and while that policy shift looks increasingly likely, markets may be overestimating the speed and extent of the shift.
In the US for example, traders were pricing in as many as six 25bps interest rate cuts from the Federal Reserve next year, starting as soon as the central bank’s March meeting. Even if inflation continues to moderate and the labor market slows, March seems like the absolute earliest that Jerome Powell and Company could conceivably start cutting interest rates, so we may be approaching a scenario where the most dovish possible outcome is already almost fully discounted.
Time will tell, but after a big dovish shift in market expectations last week, there’s potential for the pendulum to swing back toward a more balanced outlook for central banks as we head into the holiday period.
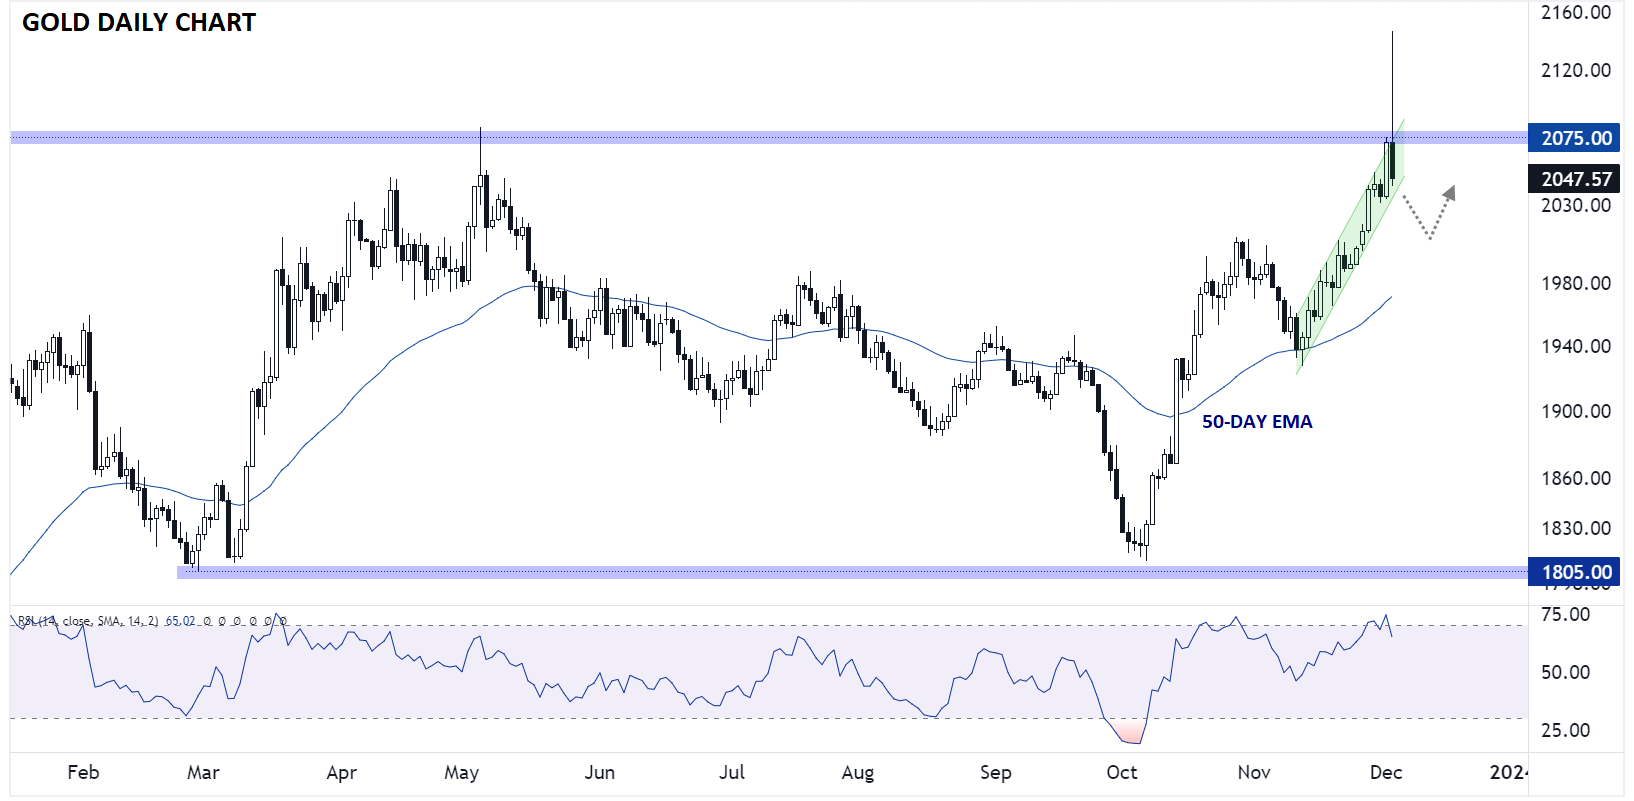
Gold Technical Analysis – XAU/USD Daily Chart
Source: TradingView, StoneX
Looking at the chart, we can see today’s dramatic reversal in gold more clearly. As we go to press, the yellow metal is trading down nearly 5% from its intraday high near $2150. The massive daily range is suggestive of a significant candle with high trading volume, so assuming we close today below the $2075 level, it could mark a near-term top for the yellow metal.
Moving forward, a break below last Thursday’s low and the near-term bullish channel in the $2030 zone could open the door for a deeper pullback toward $2000, near the rising 50-day EMA before the longer-term bullish trend reasserts itself.
-- Written by Matt Weller, Global Head of Research
Follow Matt on Twitter: @MWellerFX
Related tags:
Latest market news




The complete CFD trading experience
Award-winning platforms, competitive spreads, low commissions and dedicated support.
We live and breathe the markets and are dedicated to helping traders realise their ambitions as we continue to set the industry bar.
Economic calendar
Web Trader platform
Our sophisticated web-based platform is packed with features.
Related articles
USD/JPY Q4 2026 Outlook: Hawkish Fed Pricing Clashes With Intervention Risk
The year-end tug-of-war is clear: hawkish Fed pricing supports USD/JPY, while intervention risk limits the upside.
USD/CAD and USD/MXN Q4 2026 Outlook: Will the U.S. Dollar Dominate North America Again?
The final stretch of 2026 is approaching, and North America's major currencies have begun to show a shift in the strength dynamics seen earlier in the year. New expectations of a more aggressive monetary policy stance, particularly in the United States, could be significantly reshaping the outlook for the region. At the same time, this backdrop, combined with potential trade tensions across North America, may become one of the most important drivers of currency performance in the months ahead.

Japanese Yen Forecast: USD/JPY 4% Rally Challenges Post-Intervention Downtrend 9 24 2026
USD/JPY momentum has shifted sharply higher, putting a major resistance confluence in focus as U.S. and Japanese event risk builds.

StoneX Europe Ltd may make third party material available on this website which may contain information included but not limited to the conditions of financial markets. The material is for information purposes only and does not contain, and should not be construed as containing, investment advice and/or investment recommendation and/or an investment research and/or an offer of or solicitation for any transactions in financial instruments; any decision to enter into a specific transaction shall be made by the client following an assessment by him/her of their situation.
StoneX Europe Ltd makes no representation or warranty and assumes no liability as to the accuracy or completeness of the information provided, nor any loss arising from any investment based on a recommendation, forecast or other information supplied. You should always seek independent advice as to your suitability to speculate in any related markets and your ability to assume the associated risks, if you are at all unsure. We are not under any obligation to update any such material. Any opinion made may be personal to the author and may not reflect the opinion of StoneX Europe Ltd.