




Gold Intraday Will Trump Trigger an Upside Breakout for Gold
Spot gold has shown resilience over the past two trading sessions, and U.S. President will make an announcement regarding new policies on China later today...
Share this:

Spot gold has shown resilience over the past two trading sessions, recouping most of its losses made on Tuesday, as there are growing signs of an escalation of U.S.-China political battle.
In answering a question on the phase one trade deal with China, U.S. President Donald Trump told reporters that he is "not happy with what has happened" and will make an announcement regarding new policies on China later today.
China state-run news agency, the Global Times commented that the "Hong Kong Battle" between China and the U.S. has already begun, and U.S. "sanctions are like bluffing less than half a bottle of beer".
In one of the worst case scenario, if Trump decides to terminate the phase one trade deal with China, it could be a catalyst for gold prices.
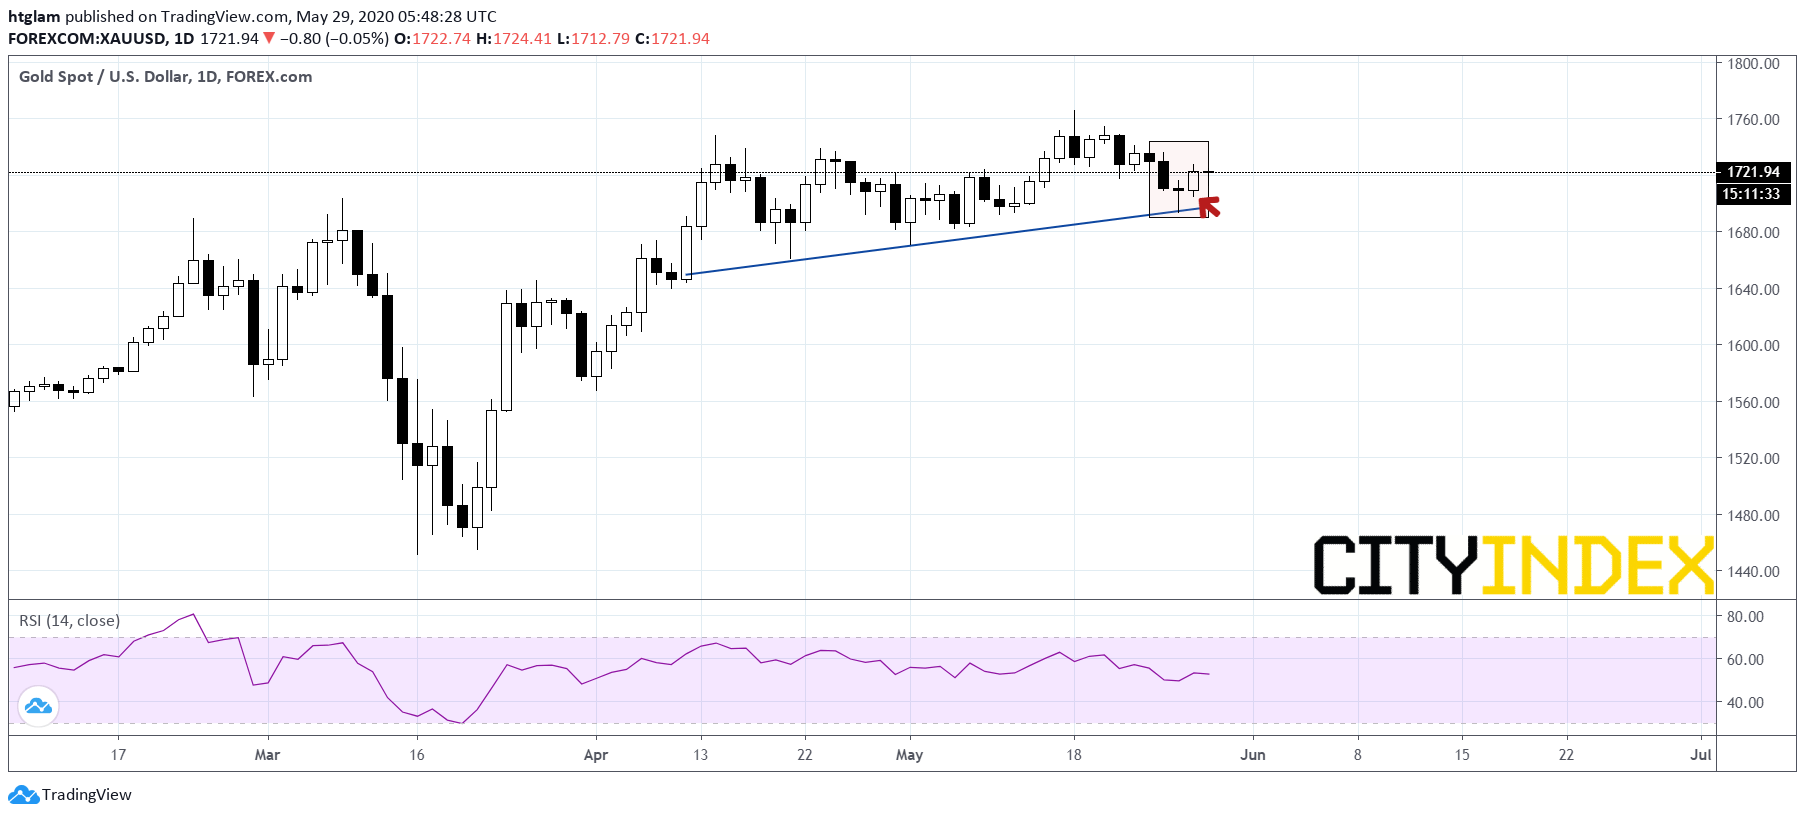
Technically, spot gold has not shown a clear upside breakout from the bearish channel drawn from May 18, as shown on the 1-hour chart. Nevertheless, a longer term rising trend line is still valid and a bullish morning star pattern has just formed on the daily-chart.
From a technical point of view, spot gold maintains a bullish bias above its nearest support at $1,705, with prices likely to test the 1st and 2nd resistance at $1,736 and $1,754. Alternatively, losing $1,705 might suggest the next support at $1,696 would be threatened.
Spot gold 1-hour chart:

Source: TradingView, Gain Capital
Spot gold daily chart:
Source: TradingView, Gain Capital
Spot gold has shown resilience over the past two trading sessions, recouping most of its losses made on Tuesday, as there are growing signs of an escalation of U.S.-China political battle.
In answering a question on the phase one trade deal with China, U.S. President Donald Trump told reporters that he is "not happy with what has happened" and will make an announcement regarding new policies on China later today.
China state-run news agency, the Global Times commented that the "Hong Kong Battle" between China and the U.S. has already begun, and U.S. "sanctions are like bluffing less than half a bottle of beer".
In one of the worst case scenario, if Trump decides to terminate the phase one trade deal with China, it could be a catalyst for gold prices.
Technically, spot gold has not shown a clear upside breakout from the bearish channel drawn from May 18, as shown on the 1-hour chart. Nevertheless, a longer term rising trend line is still valid and a bullish morning star pattern has just formed on the daily-chart.
From a technical point of view, spot gold maintains a bullish bias above its nearest support at $1,705, with prices likely to test the 1st and 2nd resistance at $1,736 and $1,754. Alternatively, losing $1,705 might suggest the next support at $1,696 would be threatened.
Spot Gold 1-hour chart:

Source: TradingView, Gain Capital
Spot gold daily-chart:
Source: TradingView, Gain Capital
Related tags:
Latest market news




The complete CFD trading experience
Award-winning platforms, competitive spreads, low commissions and dedicated support.
We live and breathe the markets and are dedicated to helping traders realise their ambitions as we continue to set the industry bar.
Economic calendar
Web Trader platform
Our sophisticated web-based platform is packed with features.
Related articles
Gold Price Outlook: XAU/USD Resistance at $4200 Sets Up for NFP
It was a strong sell-off to start the week in gold and despite a Tuesday bounce, sellers are continuing to push following a resistance hit at the $4200 level.


Treasury Yields Lose Momentum as Energy ETF Retreats
The 10-year Treasury yield is testing a resistance zone respected since the 1920s, as bearish RSI divergence signals fading upside momentum.


Gold Forecast: Are Bears Regaining Control of XAU/USD?
The start of the trading week has not been particularly favorable for gold. This can be seen in recent XAU/USD price action, with the metal falling nearly 4.00% over the last two trading sessions and bringing renewed attention to a bearish bias within the market.
StoneX Europe Ltd may make third party material available on this website which may contain information included but not limited to the conditions of financial markets. The material is for information purposes only and does not contain, and should not be construed as containing, investment advice and/or investment recommendation and/or an investment research and/or an offer of or solicitation for any transactions in financial instruments; any decision to enter into a specific transaction shall be made by the client following an assessment by him/her of their situation.
StoneX Europe Ltd makes no representation or warranty and assumes no liability as to the accuracy or completeness of the information provided, nor any loss arising from any investment based on a recommendation, forecast or other information supplied. You should always seek independent advice as to your suitability to speculate in any related markets and your ability to assume the associated risks, if you are at all unsure. We are not under any obligation to update any such material. Any opinion made may be personal to the author and may not reflect the opinion of StoneX Europe Ltd.