






Gold Rally Faces Resistance Heading Into July
Gold’s rally shows signs of exhaustion with bearish patterns forming and seasonal weakness ahead. Is another pullback on the cards in July?
Share this:
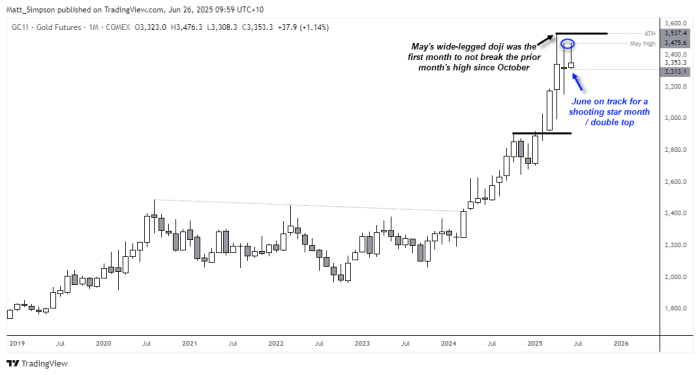
Gold’s months-long rally is losing momentum, with price action shifting from relentless record highs to choppy consolidations. May marked a clear change in character, printing a wide-legged doji and failing to break the prior month’s high for the first time since October. Now, June appears on track to form a shooting star reversal and possible double top near 3475. Layer in seasonal weakness and fading bullish momentum, and gold may be preparing for at least one more leg lower—unless bulls can break convincingly above May’s peak.
View related analysis:
- Gold Price Outlook: Can Bearish Technical Setup and June Weakness Align?
- Gold Outlook: Seasonal Weakness and Fading Momentum Hint at June Pullback
- Crude Oil Crashes as Iran's Muted Response Fuels Wall Street Rebound
- EUR/USD, GBP/USD Extend Rallies as US Dollar Index Tests Support
View related analysis:
- Gold Price Outlook: Can Bearish Technical Setup and June Weakness Align?
- Gold Outlook: Seasonal Weakness and Fading Momentum Hint at June Pullback
- Crude Oil Crashes as Iran's Muted Response Fuels Wall Street Rebound
- EUR/USD, GBP/USD Extend Rallies as US Dollar Index Tests Support
Gold Futures (GC) Technical Analysis: Monthly Chart
Over the past couple of months, I’ve outlined a case for gold to face choppier conditions and flagged the potential for a pullback. While prices remain elevated, traders have had to adjust to a market that no longer delivers record high after record high, but instead oscillates within prior months’ ranges.
May was the first month since October where bulls failed to lift gold above the previous month’s high. Although May’s wide-legged doji still shows elevated prices, it also signals a shift in character from the strong four-month rally that ran from around 2700 to 3500. Now, with June shaping up as a shooting star reversal and a potential double top near 3475, I suspect gold may be due for at least one more leg lower—unless we see a convincing break above the May high.
Gold’s Seasonal Weakness in June Could Spill Into July
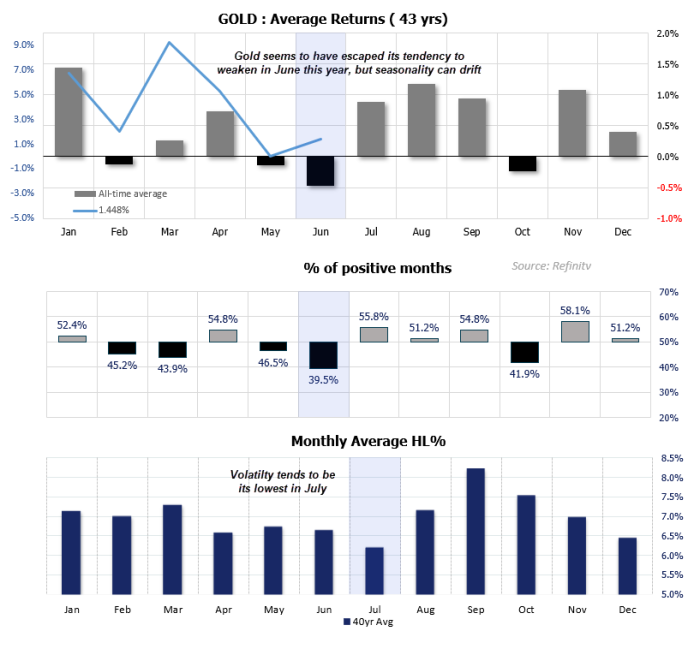
Let’s not forget, June has historically been the most bearish month for gold based on seasonal data over the past 43 years. Not only does it average the weakest returns, it also has the lowest win rate. While gold has so far dodged significant losses this month (currently up 1% for June), seasonality can shift—so perhaps a bearish July is what traders should be on guard for.
However, July also tends to be one of the quietest months of the year for markets, with volatility typically subdued during the US summer. This could limit gold’s downside—unless the US dollar surprises with a strong rally—but it also suggests that any upside may remain capped, leaving gold bulls facing a more range-bound environment.
Gold Futures (GC) Technical Analysis: Daily Chart
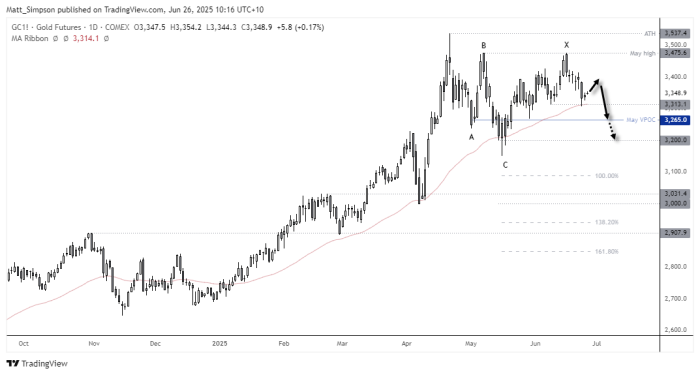
Gold futures have declined -4.8% from the June 16 high, which is significant as I previously wrote that a break above that area could invalidate the potential for a larger correction lower. The rally from wave ‘C’ is not impulsive, which means another ABC move lower (double zig zag) remains a potential scenario.
However, support has been found at the 50-day EMA, near the 1313 swing low. A small bullish inside day also formed to show a loss of bearish momentum over the near term.
- The bias is for a minor bonce from current levels
- The preference is to fade into such moves in anticipation of a break below 3200
- The May VPOC (3265) and 3200 handle are next downside targets for bears
- Should a larger ABC move lower unfold it could allow for some sizeable rallies along the way, but a 100% projection of A-C lands just below 3100 for reference, and a move to 3,000 could also be on the cards
View the full economic calendar
View the full economic calendar
-- Written by Matt Simpson
Follow Matt on Twitter @cLeverEdge
How to trade with City Index
You can trade with City Index by following these four easy steps:
- Open an account, or log in if you’re already a customer
• Open an account in the UK
• Open an account in Australia
• Open an account in Singapore
- Search for the market you want to trade in our award-winning platform
- Choose your position and size, and your stop and limit levels
- Place the trade
Related tags:
Latest market news




The complete CFD trading experience
Award-winning platforms, competitive spreads, low commissions and dedicated support.
We live and breathe the markets and are dedicated to helping traders realise their ambitions as we continue to set the industry bar.
Economic calendar
Web Trader platform
Our sophisticated web-based platform is packed with features.
Related articles
StoneX Europe Ltd may make third party material available on this website which may contain information included but not limited to the conditions of financial markets. The material is for information purposes only and does not contain, and should not be construed as containing, investment advice and/or investment recommendation and/or an investment research and/or an offer of or solicitation for any transactions in financial instruments; any decision to enter into a specific transaction shall be made by the client following an assessment by him/her of their situation.
StoneX Europe Ltd makes no representation or warranty and assumes no liability as to the accuracy or completeness of the information provided, nor any loss arising from any investment based on a recommendation, forecast or other information supplied. You should always seek independent advice as to your suitability to speculate in any related markets and your ability to assume the associated risks, if you are at all unsure. We are not under any obligation to update any such material. Any opinion made may be personal to the author and may not reflect the opinion of StoneX Europe Ltd.