


Gold Reclaims 5000, Nasdaq Reclaims Bearish Bias
Gold, Nasdaq Outlook: ongoing geopolitical instability, coupled with the latest AI revenue concerns, realigned gold prices above the 5,000 barrier and pushed Nasdaq into another pullback from the 26,000 zone.
Share this:

Key Events
• Partial U.S. government shutdown delays NFP data, shifting market focus toward key technical levels and geopolitical headlines
• Gold reclaims the 5,000 barrier on persistent haven demand; Nasdaq pulls back from the 26,000 zone amid rising AI concerns
The Second Year Under Trump Marks a Tough Start
Looking at markets from a broader angle, we are now navigating the second year under Trump’s presidency, following a year of exhausted market sentiment shaped by shifting policies and geopolitical landscapes. Historically, markets have often leaned into consolidation phases during a new president’s second year, allowing sentiment and momentum to recharge. This time, however, heightened uncertainty has sharply boosted haven demand toward record levels, rather than supporting U.S. equity indices.
The 1,000-point surge and drop in gold prices last week capped unprecedented volatility ranges across metals, which marked a turning point near the 2025 highs before surging back above key barriers at 5,000 for gold and 90 for silver. The gold volatility index has since cooled after reaching levels last seen in 2020, potentially stabilizing metals within their new price zones as U.S.–Iran negotiations and U.S. government resolutions unfold.

Mean Reversion Risks in February
In line with my previous analysis on US Dollar pairs, Another cycle often observed across the years is the “new year effect,” defined by strong early-year rallies followed by mean reversion risks toward the end of the first quarter, allowing markets and momentum to recalibrate before moving forward. While this cycle is not guaranteed to repeat, given current market conditions, a much-needed drawdown before primary trends extend would not be surprising.
Distribution phases, or extended consolidations near chart highs, often precede notable drawdowns. In U.S. indices, a distribution structure began forming toward the end of 2025, capping the anticipated Santa rally and signaling caution for the year ahead. For Nasdaq, consolidation remains visible below the October 2025 high near 26,300, with price failing to break higher. This has extended a neutral-to-bearish outlook, reinforced by recent weekly price action and ongoing AI margin cost concerns relative to expected revenue streams.
Quantifying Uncertainty: Technical Analysis
Gold Outlook: 3-Month and 2 Week Time Frames
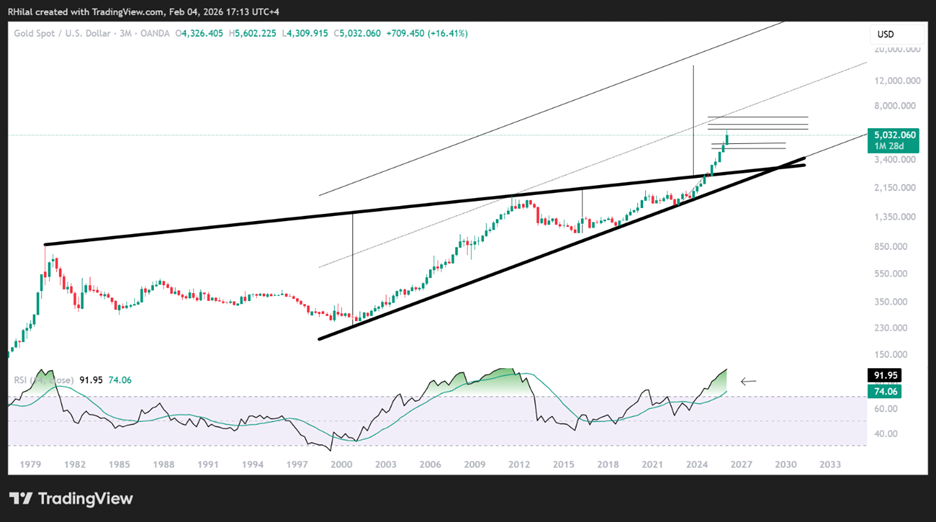
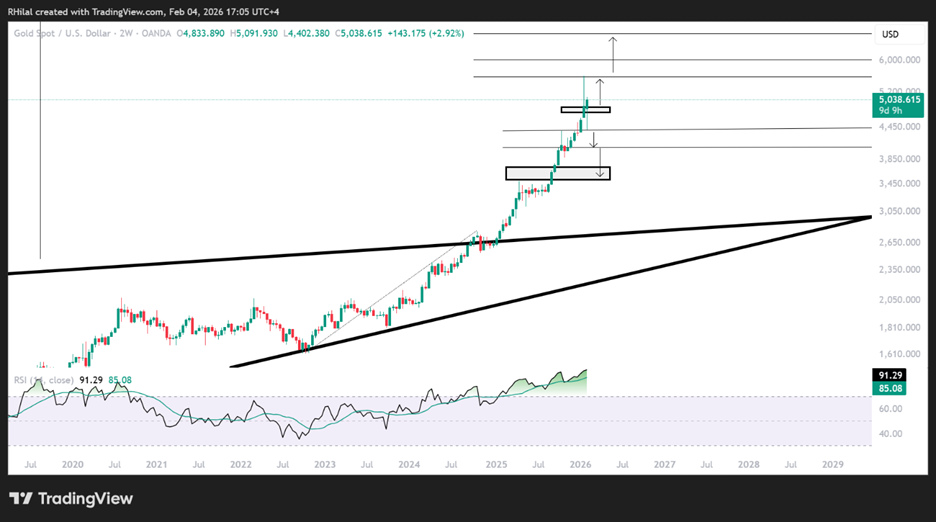
Source: Trading view
Given gold’s new volatility regime, the 3-month timeframe is used to reflect the primary uptrend’s longer-term potential, possibly extending beyond the 10,000 mark. This follows the exponential surge between January 2025 and 2026, breaking beyond the boundaries of a 46-year consolidation dating back to the 1980s. That said, steep overbought momentum conditions remain visible on the chart, supporting the case for a retracement back toward the upper bound of the prior consolidation before any extension toward higher long-term targets.
Zooming in, the 2-week chart highlights the uptrend in place since October 2022, marking a new trend emerging from the inner boundary of the consolidation. Upside potential is measured using Fibonacci extensions based on the October 2022 low at 1,730, the October 2024 high at 2,790, and the November 2024 low at 2,530. The 2.618 extension aligns with resistance near 5,600, while the next Fibonacci ratios between 3.618 and 4 align with the 6,040 and 6,780 levels.
On the downside, should another drawdown develop below the 4,900 and 4,500 levels, key areas to watch include 4,380, 4,060, and 3,700 as potential dip-buying zones. These levels align with Fibonacci retracement ratios of the trend spanning between November 2024 and January 2026.
Nasdaq Outlook: 3-Day Time Frame – Log Scale
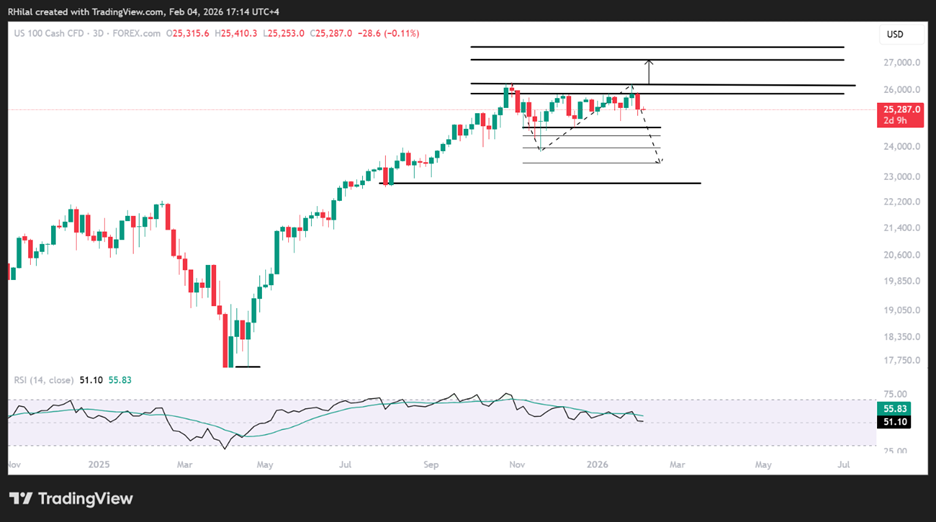
Source: Trading view
Over five pullbacks can be observed on the 3-day Nasdaq chart below the 26,000 threshold, extending a potential distribution phase between October and February 2026. This keeps key levels in focus to confirm a constructive drawdown, aligned with unsustained highs and deepening bearish candle bodies on one hand, and the RSI rolling down toward the neutral barrier from above on the other.
Upside scenario:
A sustained hold back above 25,500, followed by 25,900 and 26,300, is needed to reassert bullish continuation and shift bias toward levels beyond the 27,000 threshold.
Downside scenario:
The October 2025 highs may support a three-legged corrective structure, as illustrated on the chart, should a clean hold below 24,900 and 24,600 materialize. This would extend drawdown risks toward 24,300, 23,900, and 23,400, respectively.
Written by Razan Hilal, CMT
Follow on X: @Rh_waves


The complete CFD trading experience
Award-winning platforms, competitive spreads, low commissions and dedicated support.
We live and breathe the markets and are dedicated to helping traders realise their ambitions as we continue to set the industry bar.
Economic calendar
Web Trader platform
Our sophisticated web-based platform is packed with features.
Related articles
EUR/USD, GBP/USD Outlook: RSI Hits 2020 Oversold Levels
EUR/USD, GBP/USD Outlook: The EUR/USD daily RSI has fallen to oversold levels last seen in 2020, raising the risk of a reversal across correlated currency pairs, including the US dollar and GBP/USD.

Nikkei breakout accelerates as yen weakness returns
Nikkei has started October with a powerful breakout, helped by renewed yen weakness and strong upside momentum


AUD/USD hammered by US yields and fading RBA hike bets
US yields, dollar strength and fading RBA hike bets have combined to drive AUD/USD to fresh multi-month lows. The macro and technical bias remains bearish, although history suggests parts of the move are now reaching unusually stretched levels.
StoneX Europe Ltd may make third party material available on this website which may contain information included but not limited to the conditions of financial markets. The material is for information purposes only and does not contain, and should not be construed as containing, investment advice and/or investment recommendation and/or an investment research and/or an offer of or solicitation for any transactions in financial instruments; any decision to enter into a specific transaction shall be made by the client following an assessment by him/her of their situation.
StoneX Europe Ltd makes no representation or warranty and assumes no liability as to the accuracy or completeness of the information provided, nor any loss arising from any investment based on a recommendation, forecast or other information supplied. You should always seek independent advice as to your suitability to speculate in any related markets and your ability to assume the associated risks, if you are at all unsure. We are not under any obligation to update any such material. Any opinion made may be personal to the author and may not reflect the opinion of StoneX Europe Ltd.