



Gold’s $4k Test Ongoing Despite Monetary Mayhem Elsewhere
Gold has been downright calm of late, at least on a relative basis, and the question now is whether the tide will turn for bulls following more than a month of support tests at the vaulted $4k level.
Share this:

Gold Talking Points:
- Gold has tested $4k for five of the past six weeks and sellers have yet to hold a weekly close below the big figure.
- The past two weeks have shown higher-lows, illustrating a degree of defense at that price.
- I looked into the matter in greater depth in a video for StoneX TV, linked below.
This content was created by an affiliate of FOREX.com and represents the views and opinions of the author/speakers, not the views and opinions of Forex.com, StoneX Group Inc., or its subsidiaries. The content has not been independently reviewed by FOREX.com.
Gold came into the year with a full head of steam, but 2026 certainly hasn’t gone that way for bulls as the past six months have seen sellers taking a strong swing at the matter.
Of late, however, the bigger item has been slowing volatility as gold price action has compressed, with the $4k level coming in to hold the lows. This was a price that bears shied away from on the initial portion of the pullback in March. And then again in early-June. What ultimately drove gold down for a $4k test as the FOMC rate decision on June 17th but, so far, bulls have come in for a strong defense of that level.
From the weekly chart below, we can see where five of the past six weeks have wicks testing that level. This shows that while price may have dipped below during the week, buyers showed up, thereby exposing underside wicks on the weekly chart.
And for the past two weeks, buyers have shown greater anticipation by jumping in at higher-lows, alluding to the possibility that sellers are giving way to greater buying pressure and bulls are ramping up their appetite on the long side of gold.
Gold Weekly Chart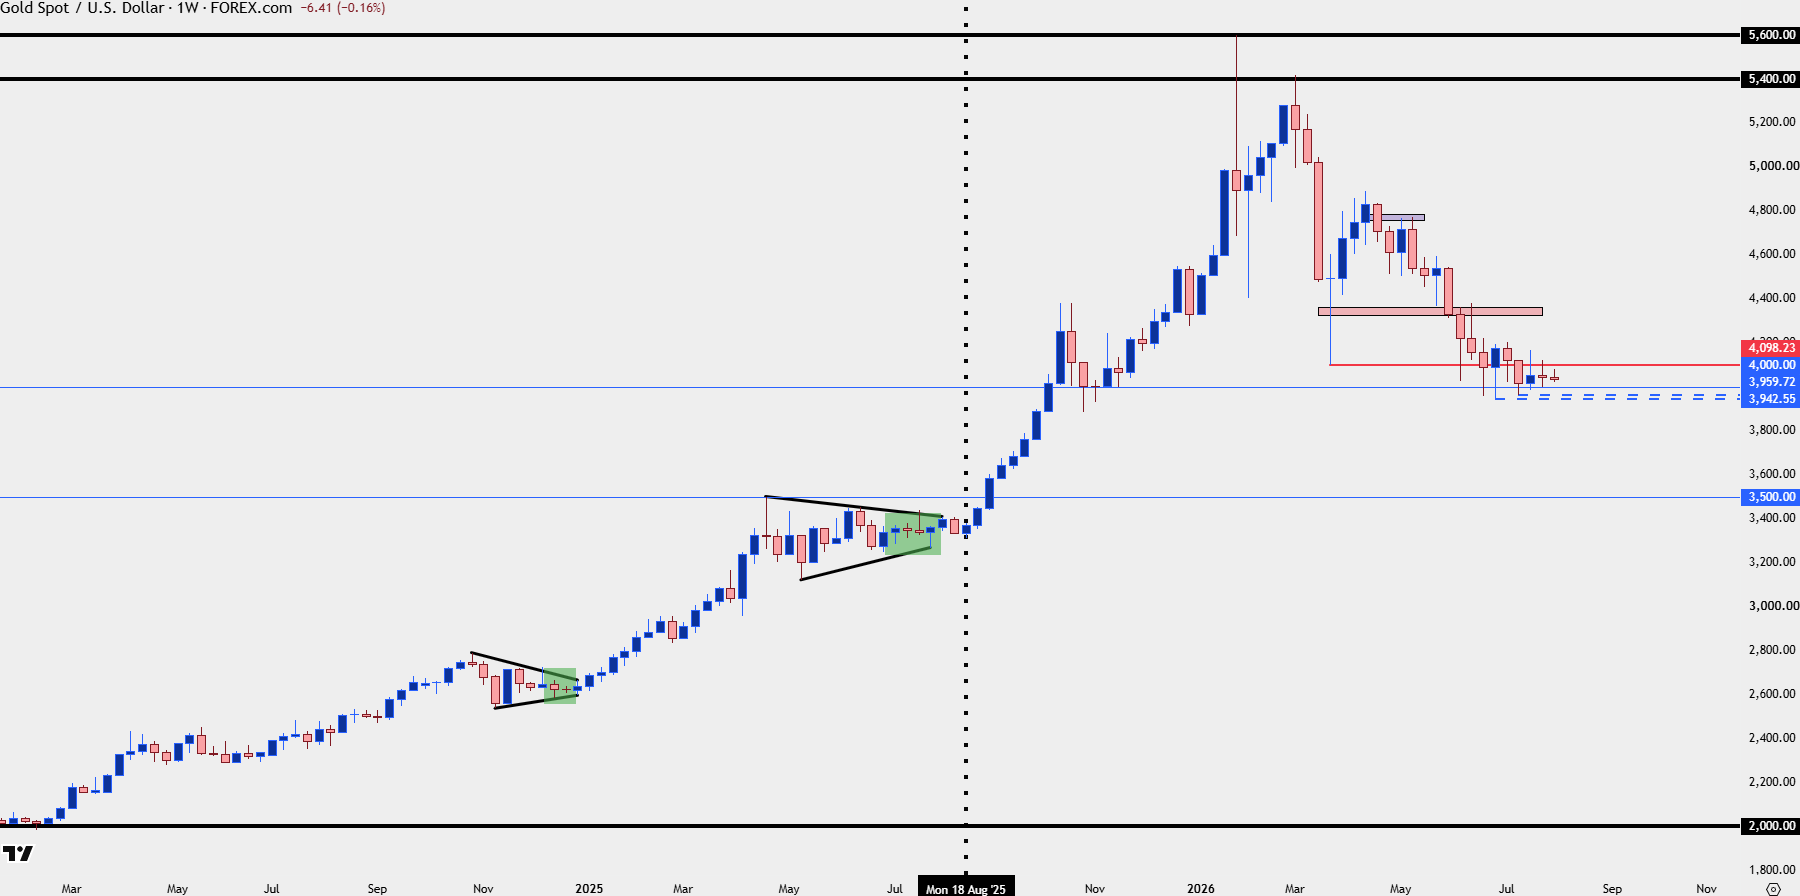
Chart prepared by James Stanley; data derived from Tradingview
Gold Turn Potential
A slowing sell-off can lead to a bullish reversal, but it’s still too early to say that definitively. As traders, instead, the best that we can do is place a line in the sand and then implement an if-then statement, and if buyers do press up to a fresh higher-high, combined with the higher-lows shown in the above chart, we can get more evidence that a turning of the tides may continue ahead.

The levels that I’m tracking for this are at $4100 and $4200, both of which provided some form of resistance over the past month. If we see buyers make a push above that latter price, then we can move forward with the idea that buyers are showing a greater degree of control over the trend, and thus, may be on the cusp of resuming the broader bullish trend.
Gold Daily Chart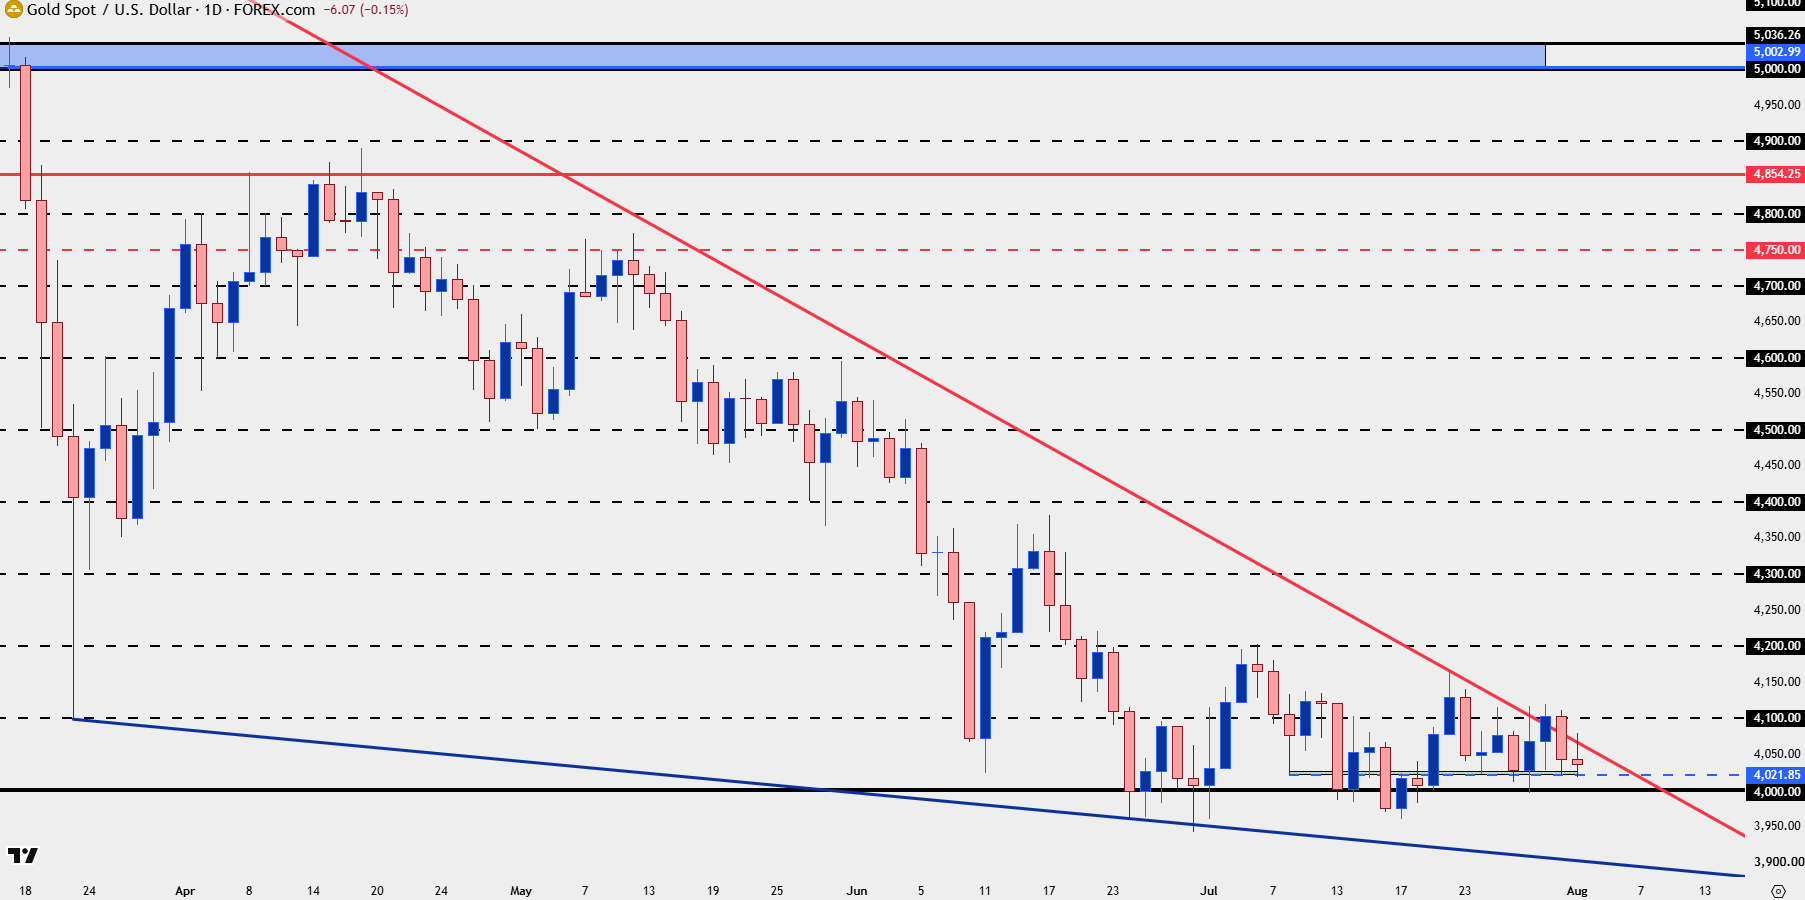
Chart prepared by James Stanley; data derived from Tradingview
--- written by James Stanley, Senior Market Analyst, Global Macro
Related tags:



The complete CFD trading experience
Award-winning platforms, competitive spreads, low commissions and dedicated support.
We live and breathe the markets and are dedicated to helping traders realise their ambitions as we continue to set the industry bar.
Economic calendar
Web Trader platform
Our sophisticated web-based platform is packed with features.
Related articles

USD/JPY Sinks to Familiar Support as Risk Off Fears Grow
Stocks are selling off in both the US and Japan and USD/JPY has started to show a degree of strain, with a pullback to a key support level even as USD-strength remains in-force elsewhere.

EUR/USD Tries to Turn, Stumbles So Far
Both US Dollar strength and EUR/USD weakness were looking long-in-the-tooth last week, and the initial semblance of reversal started to show. But kicking into a new trend has been harder than imagined so far.

Gold Technical Outlook: XAU/USD Breakdown Threatens Deeper Selloff 10 22 2026
Gold bears have broken the monthly range, with a daily close below key support threatening another sharp decline toward the yearly lows.

StoneX Europe Ltd may make third party material available on this website which may contain information included but not limited to the conditions of financial markets. The material is for information purposes only and does not contain, and should not be construed as containing, investment advice and/or investment recommendation and/or an investment research and/or an offer of or solicitation for any transactions in financial instruments; any decision to enter into a specific transaction shall be made by the client following an assessment by him/her of their situation.
StoneX Europe Ltd makes no representation or warranty and assumes no liability as to the accuracy or completeness of the information provided, nor any loss arising from any investment based on a recommendation, forecast or other information supplied. You should always seek independent advice as to your suitability to speculate in any related markets and your ability to assume the associated risks, if you are at all unsure. We are not under any obligation to update any such material. Any opinion made may be personal to the author and may not reflect the opinion of StoneX Europe Ltd.