



Gold, Silver: Metals buckle as yields spike and Hormuz risks escalate
Metals rolled over as yields surged, offering little sign of haven demand despite rising geopolitical tensions. With the risk of energy supply disruption growing after Trump’s latest threat, inflation and yield pressures may remain the dominant driver.
Share this:

- Rising yields drive the unwind in gold and silver
- Price action tracks equities, not haven demand
- Trump ultimatum met with Iranian retaliation threat
- Energy disruption risk feeds inflation and rate repricing
Trump threat and Iran response raise escalation risk
Gold and silver struggled late last week, hammered as bond yields soared and the US dollar rebounded, undermining demand for USD-denominated assets offering zero yields, such as precious metals. But it wasn't just traditional drivers that drove the unwind, with both metals behaving more like riskier asset classes than havens, sliding alongside equities as volatility picked up.
Those trends may be amplified early this week following geopolitical developments over the weekend, with US President Donald Trump threatening to “obliterate” Iran’s power plants within 48 hours if the Strait of Hormuz isn’t fully reopened, and Iran responding by warning it would shut the Strait and target US-linked energy and infrastructure across the Gulf if that happens, lifting the risk of a much bigger supply shock.
The amplification risk comes from what happens next if that threat is carried out, because it’s not hard to see how this escalates, with Iranian retaliation likely aimed at key energy and social infrastructure across the Gulf, raising the prospect of widespread and potentially lasting disruptions to production. That matters more than the Strait itself, because if supply is hit directly, the shipping channel becomes secondary.
We’ve already had a taste of how sensitive markets are to that kind of shock, with damage to a major gas facility in Qatar last week triggering a sharp repricing in short-end rates globally, lifting inflation expectations and putting upward pressure on yields further out the curve. Any similar or larger hit to supply, as this could deliver, risks reinforcing the same yield-driven pressure that weighed on gold and silver into the end of last week.
Metals trade with risk, not as havens
Source: TradingView
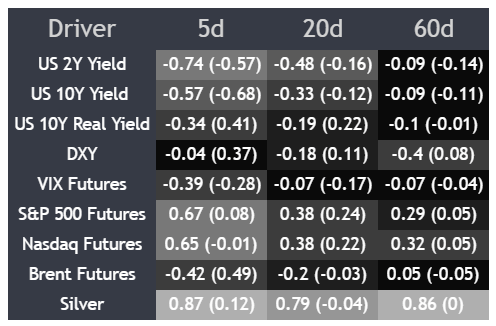
The correlation matrix reinforces that shift, with gold showing a much stronger relationship with US stock futures over the past week, almost matching the strength of its inverse relationship with US two-year yields over the same period. While both links can be traced back to moves in energy prices, it points to risk appetite playing the bigger role right now.
That matters for how to read price action this week, because if equities stabilise or push higher, it increases the chances of gold finding support, but if risk sentiment deteriorates again, it leaves metals vulnerable to further downside.
The relationship with volatility tells a similar story, with only a weak inverse correlation with VIX futures and no real sign of gold behaving like a traditional haven.
Gold slide accelerates following 50DMA break
Source: TradingView
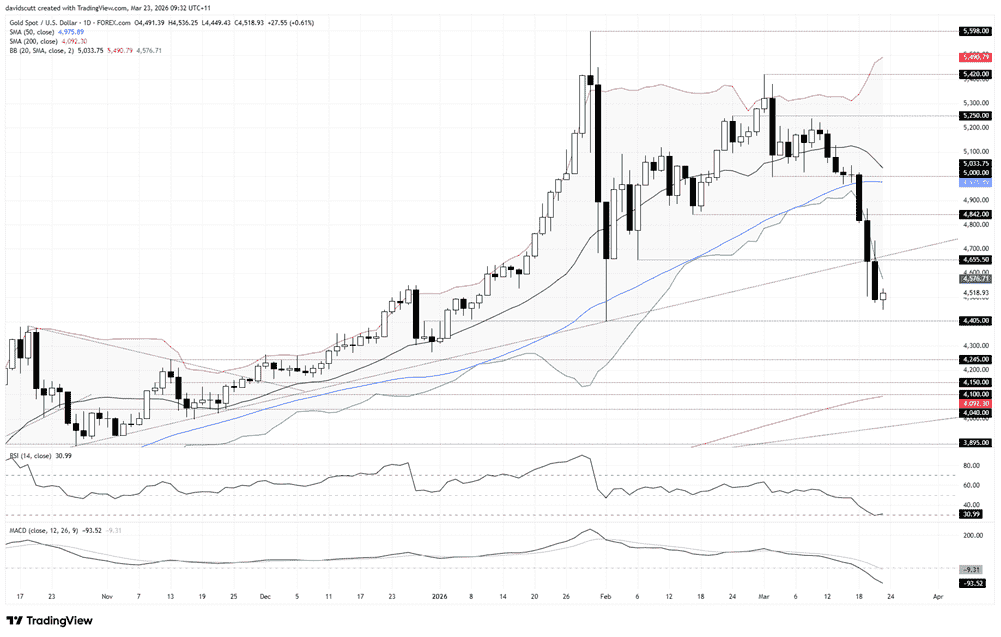
You can see it was the break of the 50DMA that sparked the accelerated unwind in gold, with losses picking up after the break and close beneath the level on Wednesday. Importantly, the sequence of higher lows following the late January rout has now ended, with price breaking and closing beneath uptrend support dating back to late October last year on Friday.
On the downside, $4405 is the level to watch, having acted as both support and resistance previously. If that were to give way, it would bring $4245, $4150, $4100 and the 200DMA into view, along with longer-term structural uptrends that have been in place for years.
RSI (14) and MACD are both trending lower and continue to flash bearish signals, favouring downside setups over topside plays for now. However, while the widening Bollinger Bands point to increased volatility, with price now sitting beneath the lower band, the risk of a squeeze is clearly there.
If we were to see a move back towards the October uptrend around $4665 today, price action at that level may prove instructive, both for those looking to exit longs and for those considering fresh shorts. A clear rejection would favour renewed downside, while a break back above would cast serious doubt over whether this develops into a more extended bearish trend.
Silver breaks lower, key zone nears
Source: TradingView
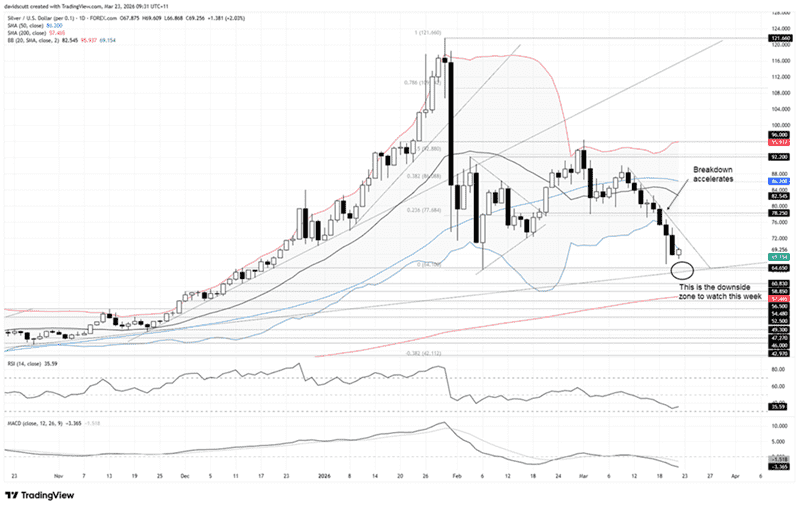
Silver unsurprisingly paints a very similar picture to gold on the daily chart, with the break beneath a support zone comprising the 23.6% fib retracement of the January-February high-low at $77.68 and horizontal support at $78.25 on Wednesday paving the way for an accelerated flush over the remainder of the week.
With RSI (14) trending lower but not yet oversold, while MACD has flipped negative after crossing the signal line from above, we have clear confirmation of a bearish bias, favouring selling into strength.
The immediate downside reference is the confluence of the February lows at $64.10, horizontal support at $64.65, and the uptrend established in August last year, which comes in around $63.50 today. The latter previously acted as support before price took off late last year and has since gone untested, making this a fairly important zone when it comes to assessing medium-term directional risks.
Below that, there’s only a string of minor levels before the 200DMA comes into view.
That said, the fact silver is trading beneath the lower Bollinger Band points to increased squeeze risk near-term, making it harder to chase downside at current levels.
On the topside, the downtrend over the past fortnight is more a reference point than a meaningful resistance level, with the real battleground sitting back in the high $70s, where last week’s breakdown began.
Latest market news




The complete CFD trading experience
Award-winning platforms, competitive spreads, low commissions and dedicated support.
We live and breathe the markets and are dedicated to helping traders realise their ambitions as we continue to set the industry bar.
Economic calendar
Web Trader platform
Our sophisticated web-based platform is packed with features.
Related articles
AUD/USD outlook: Aussie slips despite hawkish RBA ahead of key data
The AUD/USD was unable to benefit from the Reserve Bank of Australia’s 25-basis-point rate hike overnight. The RBA lifted the cash rate to 4.60%, in line with expectations. However, the Australian dollar weakened following the decision, with much of the Bank’s hawkish stance seemingly priced in ahead of the announcement. The US dollar has also remained largely supported following the recent turmoil in the bond markets.

Canadian Dollar Technical Outlook: USD/CAD Seven-Day Rally Tests Major Resistance 9 29 2026
USD/CAD is pressing into a major technical barrier after an extended advance, raising the risk for price inflection as momentum stretches.


RBA delivers 25bp hike, Bullock now the main event
The RBA delivered the expected 25bp hike, but Bullock’s press conference now looms as the bigger volatility risk for AUD/USD and the ASX 200.
StoneX Europe Ltd may make third party material available on this website which may contain information included but not limited to the conditions of financial markets. The material is for information purposes only and does not contain, and should not be construed as containing, investment advice and/or investment recommendation and/or an investment research and/or an offer of or solicitation for any transactions in financial instruments; any decision to enter into a specific transaction shall be made by the client following an assessment by him/her of their situation.
StoneX Europe Ltd makes no representation or warranty and assumes no liability as to the accuracy or completeness of the information provided, nor any loss arising from any investment based on a recommendation, forecast or other information supplied. You should always seek independent advice as to your suitability to speculate in any related markets and your ability to assume the associated risks, if you are at all unsure. We are not under any obligation to update any such material. Any opinion made may be personal to the author and may not reflect the opinion of StoneX Europe Ltd.