



Hang Seng Tech Rally Stalls Again Above 5800
Despite a generally bullish backdrop, Hang Seng Tech is struggling above 5800, with weak follow-through leaving the potential for a pullback
Share this:

- Alibaba-driven spike above 5800 fails to hold, sellers step in quickly.
- 5856 is the key level; a clean close above flips the setup bullish.
- Pullbacks to 50DMA or channel support present buying opportunities.
Hang Seng Tech Rally Stalls Above 5800
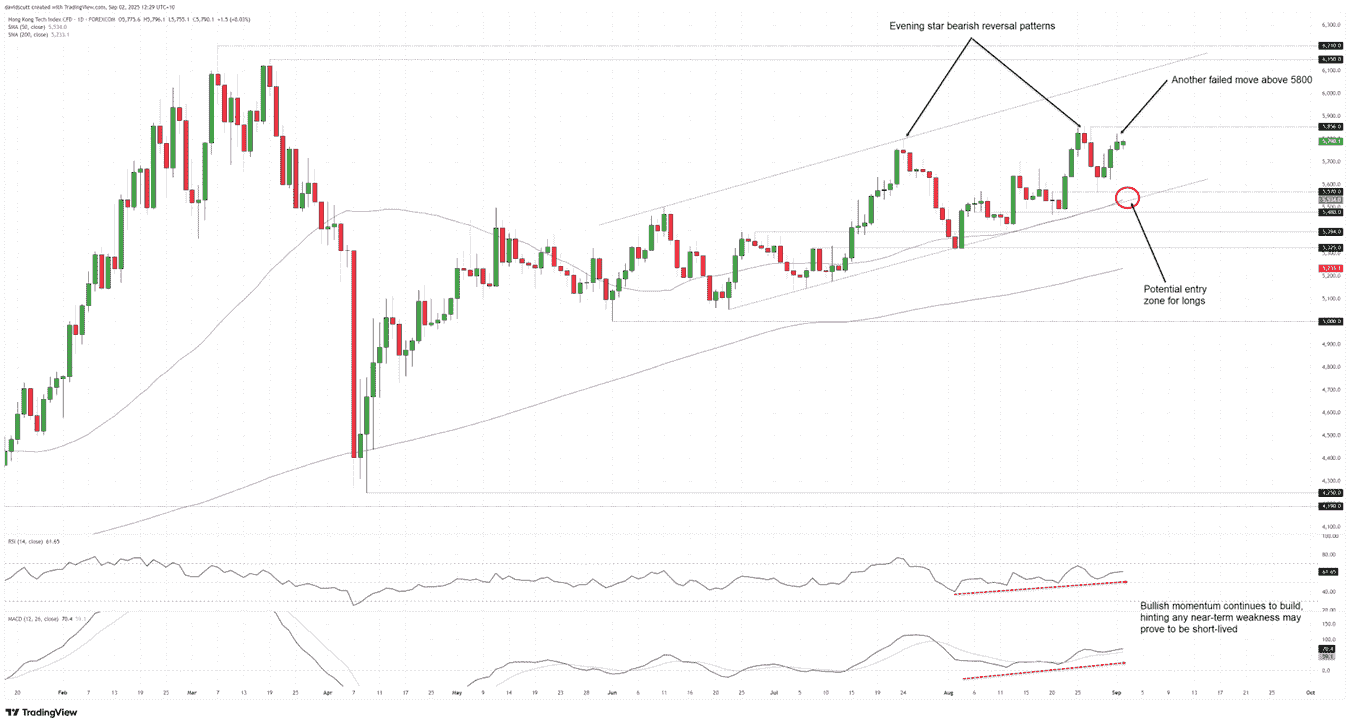
Hang Seng Tech popped above 5800 on Monday, largely on the back of Alibaba. The stock jumped 19% after reporting a strong quarterly profit, with traders focusing on growth in AI-related revenues. That surge helped lift the index, partially offsetting weakness in chipmakers. But the follow-through didn’t stick. Once Alibaba’s spike faded, so did the broader index, highlighting how fragile breakouts above 5800 remain without broader participation. The price action looked unconvincing, mirroring moves earlier in the year on probes above the level.
Another Pullback Incoming?
Source: TradingView
While the broader trend for Hang Seng Tech is undeniably bullish, without a definitive break and close above 5856, near-term directional risks may be skewing lower.
If we were to see another failed push above 5800 on Tuesday, shorts could be established beneath the level with a stop above 5856 for protection. 5700, 5570 and 50-day moving average screen as potential targets, depending on desired risk-reward from the trade.
As mentioned above, the broader trend for the contract is entirely bullish. The price is in an ascending channel with the 50 and 200-day moving averages pushing higher. RSI (14) and MACD are also generating bullish signals, favouring a similar directional bias.
As such, if the contract were to close above 5856, it would generate a bullish setup where longs could be established on the break with a stop beneath the level, targeting 6000, 6150 or 6210—the latter coinciding with 2025 year-to-date high.
Alternatively, if we were to see a pullback to channel support/50DMA and bounce, longs could be established with a stop beneath the support zone for protection against reversal. 5700, 5800 and 5856 screen as potential targets.


The complete CFD trading experience
Award-winning platforms, competitive spreads, low commissions and dedicated support.
We live and breathe the markets and are dedicated to helping traders realise their ambitions as we continue to set the industry bar.
Economic calendar
Web Trader platform
Our sophisticated web-based platform is packed with features.
Related articles
Euro Short-term Outlook: EUR/USD Selloff Nears Critical Yearly Support 9 23 2026
Euro has fallen seven of the past nine sessions, with stretched momentum raising the stakes as EUR/USD closes in on a major inflection zone.

GBP/USD forecast: US dollar surges as bonds implode
The US dollar continued to press higher deep into the European session, supported by the slump in the bond markets as yields broke out across the curve. Following the recent hawkish Fed rate hike, yield spreads between the US and the rest of the world has continually increased, and that motion continued today, helped in part by some forecast-beating US macro data and hawkish Fed commentary.


Australian Dollar Technical Outlook: AUD/USD Breakdown Threatens Deeper Correction 9 23 2026
AUD/USD remains under pressure after breaking key trend support, with the latest decline putting the focus on the next major downside pivot.
StoneX Europe Ltd may make third party material available on this website which may contain information included but not limited to the conditions of financial markets. The material is for information purposes only and does not contain, and should not be construed as containing, investment advice and/or investment recommendation and/or an investment research and/or an offer of or solicitation for any transactions in financial instruments; any decision to enter into a specific transaction shall be made by the client following an assessment by him/her of their situation.
StoneX Europe Ltd makes no representation or warranty and assumes no liability as to the accuracy or completeness of the information provided, nor any loss arising from any investment based on a recommendation, forecast or other information supplied. You should always seek independent advice as to your suitability to speculate in any related markets and your ability to assume the associated risks, if you are at all unsure. We are not under any obligation to update any such material. Any opinion made may be personal to the author and may not reflect the opinion of StoneX Europe Ltd.