







Japanese Yen Cross Currents: EUR/JPY, GBP/JPY, CHF/JPY, CAD/JPY
Geopolitical tensions and safe-haven flows are driving Japanese yen volatility. Here's a technical breakdown of key yen crosses including EUR/JPY, GBP/JPY, CHF/JPY and CAD/JPY.
Share this:

The daily direction of the Japanese yen remains firmly tied to shifts in risk appetite, largely driven by Middle East headlines. Much like the Swiss franc, the yen tends to strengthen as the Israel–Iran conflict intensifies and weaken when tensions ease. That said, the US dollar took centre stage as the safe-haven currency of choice on Tuesday, as it appeared the US was on the brink of becoming directly involved in the war.
Still, if risk sentiment continues to deteriorate, we could see a pullback across several yen crosses. In this update, we examine the technical setups for EUR/JPY, GBP/JPY, CHF/JPY, and CAD/JPY — stripping out the US dollar’s dominance ahead of today’s FOMC meeting and its newly reclaimed safe-haven status.
GBP/JPY Technical Analysis: British Pound vs Japanese Yen
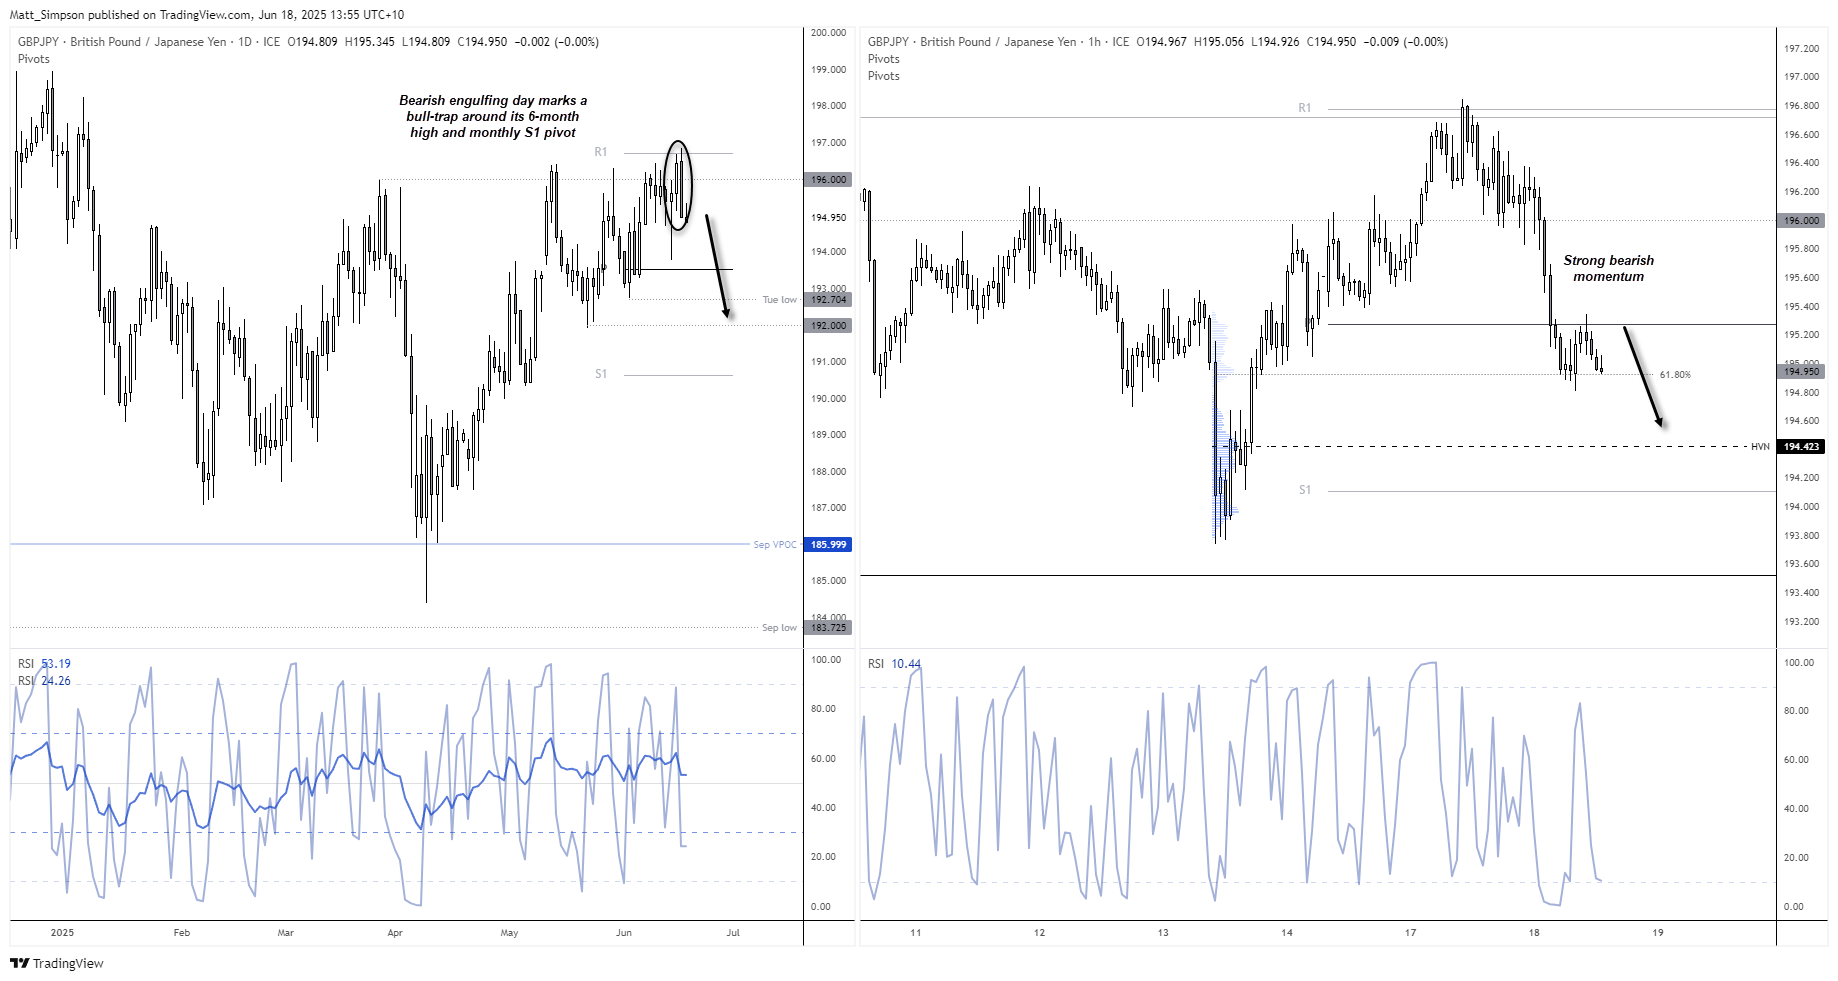
GBP/JPY formed a bearish engulfing day at the monthly R1 pivot, deeming Monday’s lacklustre breakout to its 6-month highs as a bull-trap. And it could mark the beginning of a larger move lower, given the bearish potential for the British pound.
Odds of a Bank of England (BOE) cut are on the rise thanks to soft GDP, with tax hikes also expected to depress growth next year according to CBI forecasts. And should UK inflation soften today, the British pound bulls could continue to unwind and weigh further on GBP/JPY – particularly if a risk-off environment is maintained.
The 1-hour chart shows support has been found at a 61.8% Fibonacci level. Though with momentum already turning lower after meeting resistance at the weekly pivot point (195.27), a break lower to the high-volume node (194.42) and S1 handle, just above the weekly S1 is favoured.
EUR/JPY Technical Analysis: Euro vs Japanese Yen
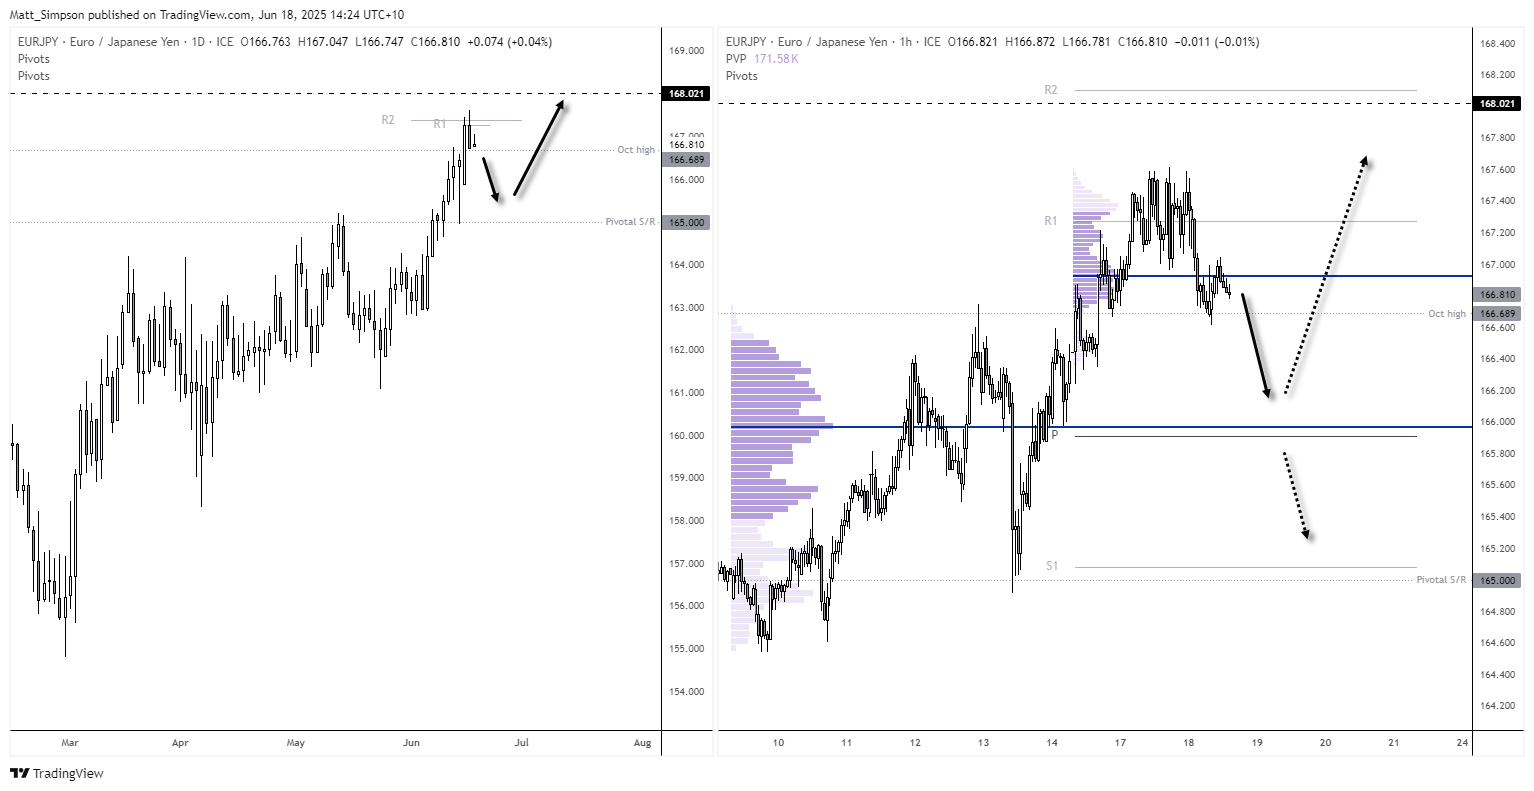
EUR/JPY: The euro has been a top performer against the Japanese yen, helping EUR/JPY climb to its most bullish level since July 2024 this week. While prices saw a relatively minor pullback on Tuesday, the leg higher from 162.80 has been a relatively clean move and the pair seems poised to reach for the 168 handle. Which is incidentally a pivotal level between June 2024 lows and July 2024 highs.
For now, prices are trying to hold above the October high (166.70), although I suspect bulls will seek dips towards the highs ~165 and seek to have another crack at 168.
Note the weekly VPOC (volume point of control) and weekly pivot point just below the 166 handle, which makes a likely support area should prices initially break lower.
CHF/JPY Technical Analysis: Swiss Franc vs Japanese Yen
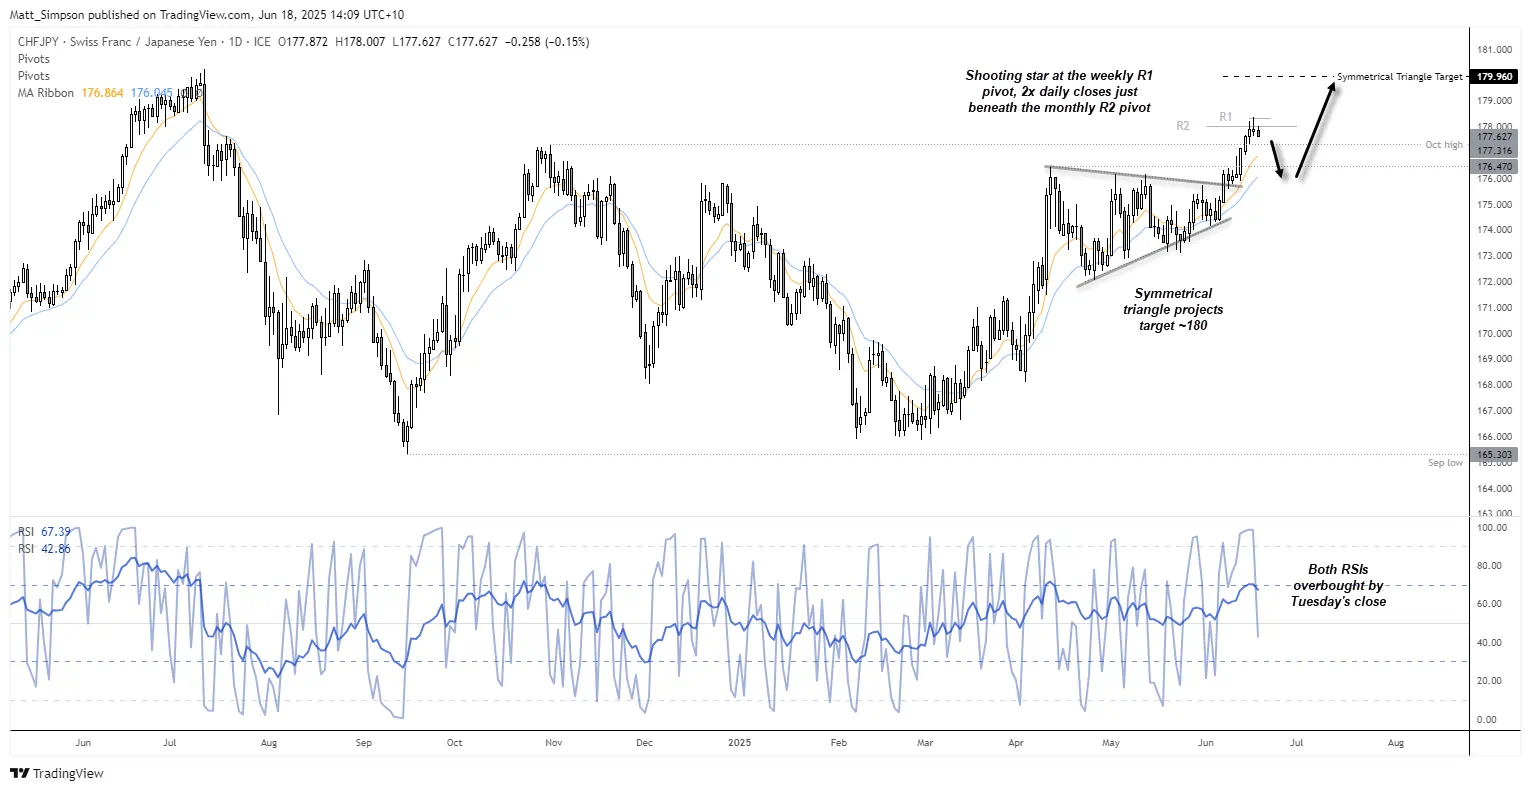
The Swiss franc has been trending higher against the Japanese yen since March, sending CHF/JPY to an 11-month high on Tuesday. Prices broke higher from a symmetrical triangle on June 6, a bullish continuation pattern which projects a bullish target just beneath the 198 handle.
However, price action has left some clues of a near-term retracement. A shooting star candle formed at the weekly R2 (178.33) with the daily RSI (14) and RSI (2) in their overbought zones. The daily chart has also closed just beneath the monthly R2 pivot (178) for the past two day. Momentum is now turning lower at the time of writing.
A break beneath October high (176.47) brings the 176.47 high into focus. However, I suspect dips buyers will be seeking to rejoin the trend. Take note that the symmetrical triangle remains in play while prices hold above ~175.
CAD/JPY Technical Analysis: Canadian Dollar vs Japanese Yen
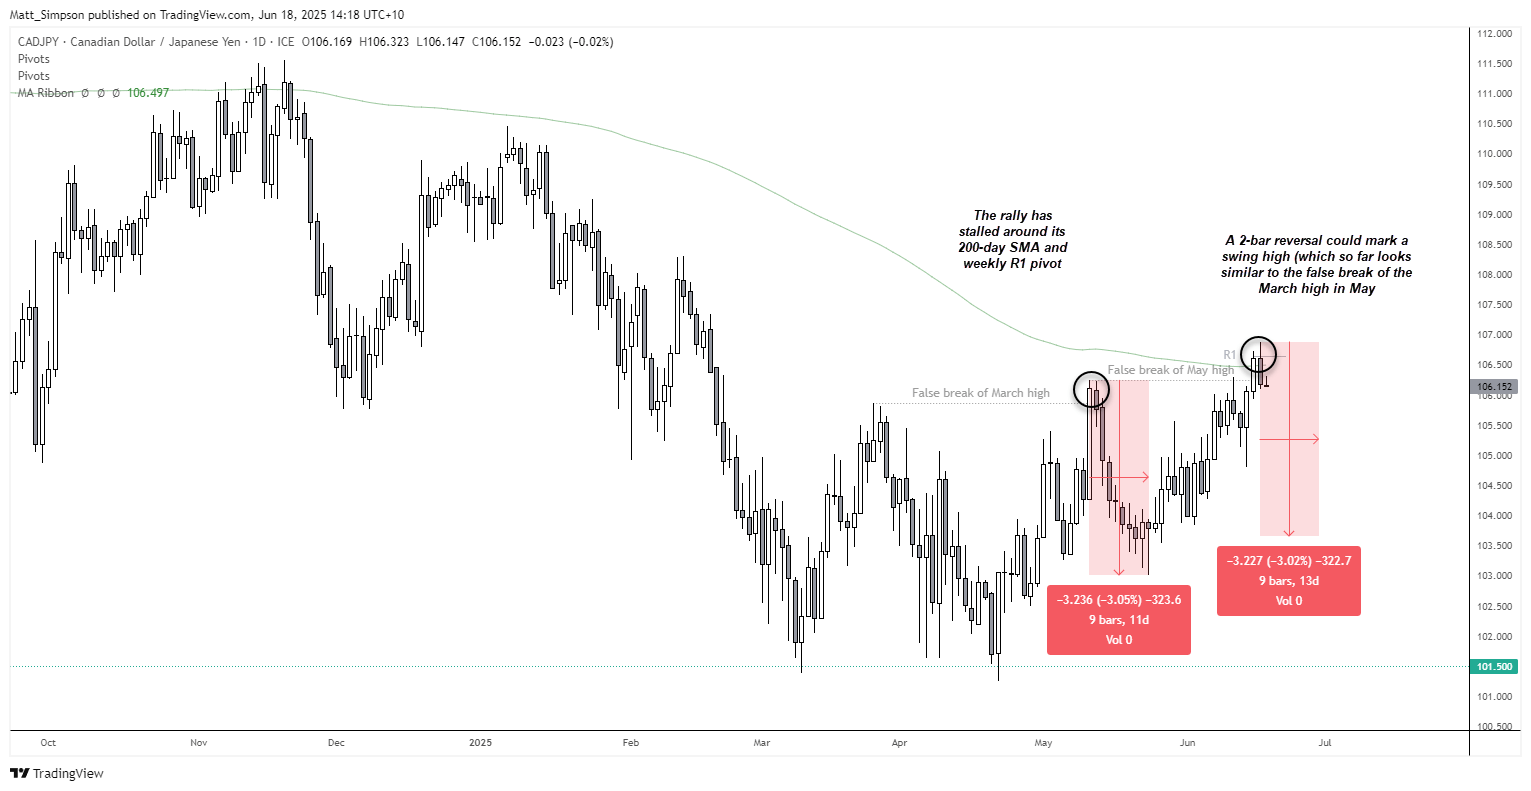
This may not be my favoured setup across the Japanese yen pairs, but CAD/JPY may be worth a look given its rally has faltered around its 200-day SMA (106.50) and weekly R1 pivot (106.65).
The daily chart shows two prominent swing highs in March and May. Yesterday’s two-bar reversal pattern (Dark Cloud Cover) is similar to what we saw om May with a false break of the March high, which resulted in a 3% correction over nine days. If history were to repeat, CAD/JPY could be sitting around 103.65 by June 17.
-- Written by Matt Simpson
Follow Matt on Twitter @cLeverEdge
How to trade with City Index
You can trade with City Index by following these four easy steps:
- Open an account, or log in if you’re already a customer
• Open an account in the UK
• Open an account in Australia
• Open an account in Singapore
- Search for the market you want to trade in our award-winning platform
- Choose your position and size, and your stop and limit levels
- Place the trade
Related tags:
Latest market news




The complete CFD trading experience
Award-winning platforms, competitive spreads, low commissions and dedicated support.
We live and breathe the markets and are dedicated to helping traders realise their ambitions as we continue to set the industry bar.
Economic calendar
Web Trader platform
Our sophisticated web-based platform is packed with features.
Related articles
USD/JPY Forecast: Is Rising Japanese Inflation Supporting the Yen?
As the trading week comes to an end, one of the most relevant developments in the FX market has been the renewed strength of the Japanese yen. This can be seen in the recent performance of USD/JPY, which has fallen nearly 1.0% over the last two trading sessions, highlighting a meaningful recovery in the Japanese currency against the U.S. dollar.
Silver forecast: metals liquidation drags XAG/USD into $50-55 support
Silver has broken its July low and slipped into a long-term support zone as the selling in precious metals deepens. The chart shows where the metal could bottom, and next week's Fed decision may decide whether it does.


Australian Dollar Forecast: AUD/USD Support Reversal Sparks Monthly Range Breakout 10 23 2026
A sharp reversal off key support has fueled the AUD/USD recovery, with resistance now in focus ahead of next week’s Fed decision and Australian CPI.

StoneX Europe Ltd may make third party material available on this website which may contain information included but not limited to the conditions of financial markets. The material is for information purposes only and does not contain, and should not be construed as containing, investment advice and/or investment recommendation and/or an investment research and/or an offer of or solicitation for any transactions in financial instruments; any decision to enter into a specific transaction shall be made by the client following an assessment by him/her of their situation.
StoneX Europe Ltd makes no representation or warranty and assumes no liability as to the accuracy or completeness of the information provided, nor any loss arising from any investment based on a recommendation, forecast or other information supplied. You should always seek independent advice as to your suitability to speculate in any related markets and your ability to assume the associated risks, if you are at all unsure. We are not under any obligation to update any such material. Any opinion made may be personal to the author and may not reflect the opinion of StoneX Europe Ltd.