





Japanese Yen Technical Analysis: USD/JPY, EUR/JPY, GBP/JPY
Yen weakness has continued to show, and USD/JPY has jumped up to a key Fibonacci level on the way to fresh three-week highs.
Share this:

Japanese Yen Talking Points:
- USD/JPY has just tested a key Fibonacci level at 150.77 as the pair extended the recent bullish sequence after breaking above the 150.00 level.
- JPY continues to be tough for Yen-bulls as USD/JPY has brewed several bear traps so far this year. For those looking for Yen-strength, EUR/JPY could present more attraction. And for Yen-weakness, GBP/JPY may be more attractive than USD/JPY.
- I’ll be looking at each of these pairs in tomorrow’s webinar and you’re welcome to join:
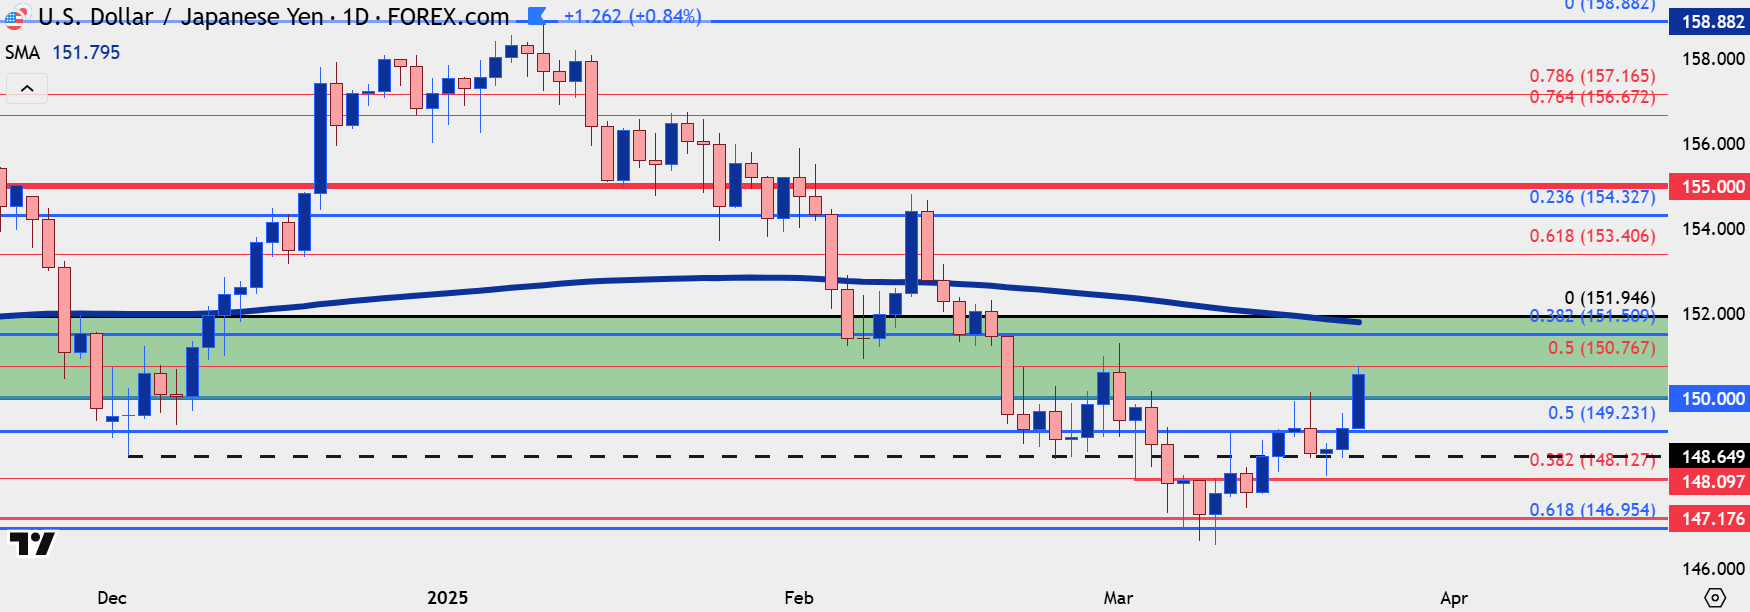
USD/JPY has continued to push higher-highs and lows with the pair re-testing a key Fibonacci level this morning at 150.77. That’s the 50% mark of the sell-off that started last July, and most recently this helped to set the highs on the final day of February and the first day of March.
Perhaps more notable is the recent sequencing of higher-highs and lows that have printed, as last week’s swing high at 150.00 was soundly broken as buyers pushed a fresh three-week-high this morning.
As looked at last week, the pair has been a tough one for bears to chase and there’s been several bear traps brewed along the way. But now that price is nearing resistance, there could be an opportune area for sellers to take their shot; although there’s a valid question as to whether USD/JPY would be more accommodative for that than a pair such as EUR/JPY, which I’ll look at below.
In USD/JPY, 150.00 is now higher-low support potential for bulls to defend, and the 149.23 level lurks below that. Above the current Fibonacci resistance level is another Fibonacci retracement from a different setup at 151.51, and that’s followed by 151.95 which is about 15 pips away from the 200-day moving average.
USD/JPY Daily Price Chart
Chart prepared by James Stanley; data derived from Tradingview
USD/JPY Shorter-Term
At this point, bulls have some context with which to defend USD/JPY, and that would be marked by the breakout over the 150.00 handle which is now higher-low support potential.
If bears can push price below that, then 149.23 is the next level up, after which 150.00 could then be sought for lower-high resistance with bearish continuation; but if 150.00 does remain defended, then 150.77 is still a big level and that’s followed by the two resistance levels looked at above, 151.51 and 151.95.
USD/JPY Four-Hour Chart
 Chart prepared by James Stanley; data derived from Tradingview
EUR/JPY
As mentioned multiple times in the past, chasing Yen-strength has been a challenge as there’s been several bear traps brewed in USD/JPY. But for those that are looking for Yen-strength, there could be a more attractive backdrop in EUR/JPY and that pair has set a recent lower-low on the four-hour chart that can justify such a stance.
As of right now, I have the pair re-testing the underside of the 200-day moving average, and just a bit higher is a spot of prior support that was in-play last week ahead of the FOMC rate decision. This is from around 153.21 up to around 163.70. If sellers can hold the pair in that region, an argument can be made for a lower-high which, when meshed with the recent lower-low, can establish a backdrop for bearish continuation scenarios.
EUR/JPY Four-Hour Chart
Chart prepared by James Stanley; data derived from Tradingview
GBP/JPY
As I had looked at earlier in March, I still think GBP/JPY could be a more attractive venue for Yen-weakness scenarios. At the time, the pair was trying to re-establish strength above the 190 handle, which it has since done. And now the pair is back in a long-term zone of interest as taken from the gap in 2008, which begins at 193.61.
You’ll notice from the monthly chart below that this gap has held resistance multiple times since it came into play last year.
GBP/JPY Monthly Chart
 Chart prepared by James Stanley; data derived from Tradingview
The bottom of that longer-term gap at 193.61 is what helped to set the high last Thursday and Friday, and buyers have made a strong push towards the 195.00 level and the 200-day moving average is currently being tested on the daily chart.
GBP/JPY Daily Chart
 Chart prepared by James Stanley; data derived from Tradingview
GBP/JPY Shorter-Term
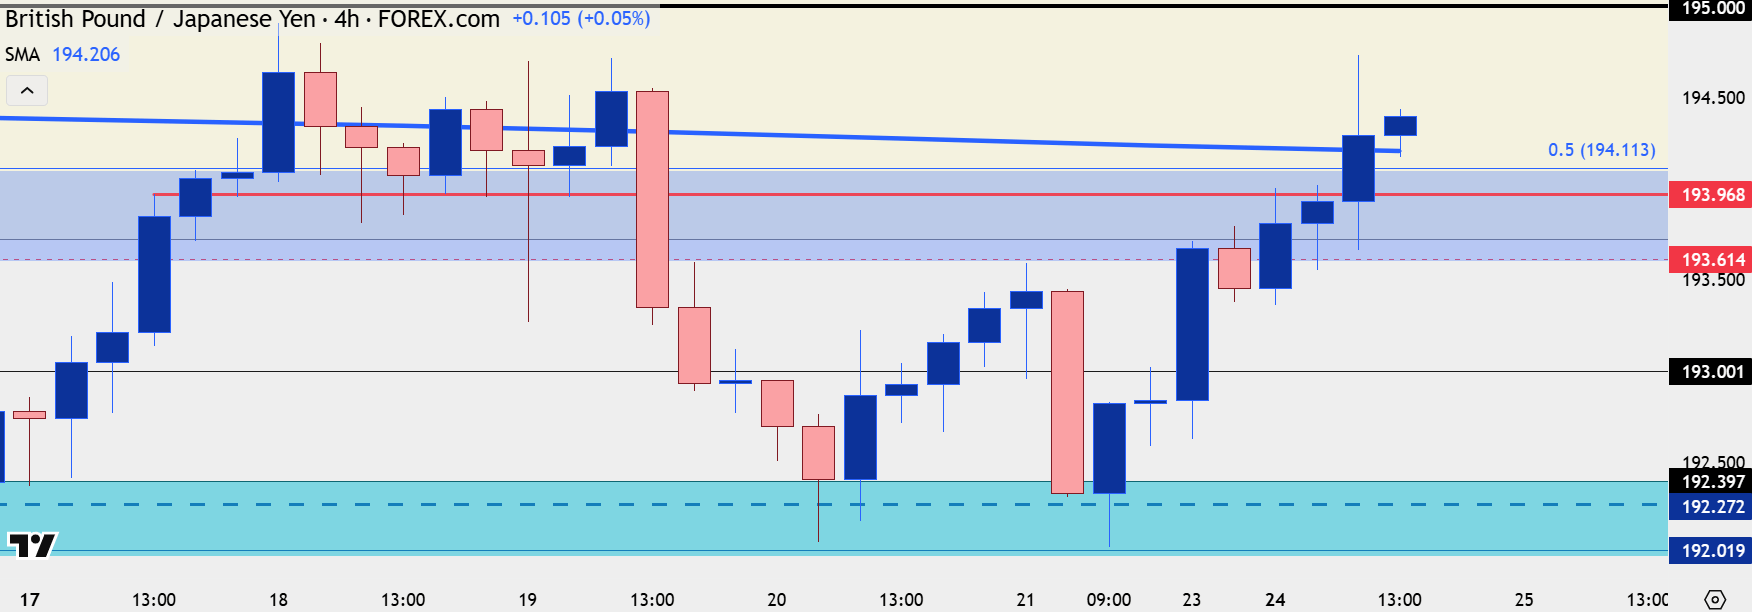
The four hour is interesting here as the pair is already making a push back above the 200-day on a shorter-term basis. Prior swing high resistance at 193.97 represents a spot of higher-low support potential, with 193.61 below that. For bullish continuation, 195.00 is the next big test and buyers shied away from that level last week, so I’d be careful about getting too aggressive on initial breakouts beyond that level until more evidence presents that buyers will be able to leave that price behind.
GBP/JPY Four-Hour Chart
--- written by James Stanley, Senior Strategist
Japanese Yen Talking Points:
- USD/JPY has just tested a key Fibonacci level at 150.77 as the pair extended the recent bullish sequence after breaking above the 150.00 level.
- JPY continues to be tough for Yen-bulls as USD/JPY has brewed several bear traps so far this year. For those looking for Yen-strength, EUR/JPY could present more attraction. And for Yen-weakness, GBP/JPY may be more attractive than USD/JPY.
- I’ll be looking at each of these pairs in tomorrow’s webinar and you’re welcome to join:
USD/JPY has continued to push higher-highs and lows with the pair re-testing a key Fibonacci level this morning at 150.77. That’s the 50% mark of the sell-off that started last July, and most recently this helped to set the highs on the final day of February and the first day of March.
Perhaps more notable is the recent sequencing of higher-highs and lows that have printed, as last week’s swing high at 150.00 was soundly broken as buyers pushed a fresh three-week-high this morning.
As looked at last week, the pair has been a tough one for bears to chase and there’s been several bear traps brewed along the way. But now that price is nearing resistance, there could be an opportune area for sellers to take their shot; although there’s a valid question as to whether USD/JPY would be more accommodative for that than a pair such as EUR/JPY, which I’ll look at below.
In USD/JPY, 150.00 is now higher-low support potential for bulls to defend, and the 149.23 level lurks below that. Above the current Fibonacci resistance level is another Fibonacci retracement from a different setup at 151.51, and that’s followed by 151.95 which is about 15 pips away from the 200-day moving average.
USD/JPY Daily Price Chart
Chart prepared by James Stanley; data derived from Tradingview
USD/JPY Shorter-Term
At this point, bulls have some context with which to defend USD/JPY, and that would be marked by the breakout over the 150.00 handle which is now higher-low support potential.
If bears can push price below that, then 149.23 is the next level up, after which 150.00 could then be sought for lower-high resistance with bearish continuation; but if 150.00 does remain defended, then 150.77 is still a big level and that’s followed by the two resistance levels looked at above, 151.51 and 151.95.
USD/JPY Four-Hour Chart
EUR/JPY
As mentioned multiple times in the past, chasing Yen-strength has been a challenge as there’s been several bear traps brewed in USD/JPY. But for those that are looking for Yen-strength, there could be a more attractive backdrop in EUR/JPY and that pair has set a recent lower-low on the four-hour chart that can justify such a stance.
As of right now, I have the pair re-testing the underside of the 200-day moving average, and just a bit higher is a spot of prior support that was in-play last week ahead of the FOMC rate decision. This is from around 153.21 up to around 163.70. If sellers can hold the pair in that region, an argument can be made for a lower-high which, when meshed with the recent lower-low, can establish a backdrop for bearish continuation scenarios.
EUR/JPY Four-Hour Chart
Chart prepared by James Stanley; data derived from Tradingview
GBP/JPY
As I had looked at earlier in March, I still think GBP/JPY could be a more attractive venue for Yen-weakness scenarios. At the time, the pair was trying to re-establish strength above the 190 handle, which it has since done. And now the pair is back in a long-term zone of interest as taken from the gap in 2008, which begins at 193.61.
You’ll notice from the monthly chart below that this gap has held resistance multiple times since it came into play last year.
GBP/JPY Monthly Chart
The bottom of that longer-term gap at 193.61 is what helped to set the high last Thursday and Friday, and buyers have made a strong push towards the 195.00 level and the 200-day moving average is currently being tested on the daily chart.
GBP/JPY Daily Chart
GBP/JPY Shorter-Term
The four hour is interesting here as the pair is already making a push back above the 200-day on a shorter-term basis. Prior swing high resistance at 193.97 represents a spot of higher-low support potential, with 193.61 below that. For bullish continuation, 195.00 is the next big test and buyers shied away from that level last week, so I’d be careful about getting too aggressive on initial breakouts beyond that level until more evidence presents that buyers will be able to leave that price behind.
GBP/JPY Four-Hour Chart
--- written by James Stanley, Senior Strategist
Related tags:




The complete CFD trading experience
Award-winning platforms, competitive spreads, low commissions and dedicated support.
We live and breathe the markets and are dedicated to helping traders realise their ambitions as we continue to set the industry bar.
Economic calendar
Web Trader platform
Our sophisticated web-based platform is packed with features.
Related articles

Japanese Yen Technical Analysis: USD/JPY Support Test into Core PCE
USD/JPY has been a battlefield for the past two months as the force of intervention and the threat of more have given sellers an advantage, even as buyers have continued to bid support on pullbacks. This sets the stage for a massive finish to the week with Core PCE and Non-farm Payrolls.

Euro Forecast: EUR/USD Tumbles Towards Yearly Low as Daily RSI Goes Oversold
EUR/USD has been hit hard in the final month of the quarter as USD strength has shown up in a big way. With the pair set to challenge its yearly low as RSI has pushed into oversold territory, is there a chance for a pullback with some big headline risk hitting in the US over the next few days?

AUD/USD outlook: Aussie slips despite hawkish RBA ahead of key data
The AUD/USD was unable to benefit from the Reserve Bank of Australia’s 25-basis-point rate hike overnight. The RBA lifted the cash rate to 4.60%, in line with expectations. However, the Australian dollar weakened following the decision, with much of the Bank’s hawkish stance seemingly priced in ahead of the announcement. The US dollar has also remained largely supported following the recent turmoil in the bond markets.

StoneX Europe Ltd may make third party material available on this website which may contain information included but not limited to the conditions of financial markets. The material is for information purposes only and does not contain, and should not be construed as containing, investment advice and/or investment recommendation and/or an investment research and/or an offer of or solicitation for any transactions in financial instruments; any decision to enter into a specific transaction shall be made by the client following an assessment by him/her of their situation.
StoneX Europe Ltd makes no representation or warranty and assumes no liability as to the accuracy or completeness of the information provided, nor any loss arising from any investment based on a recommendation, forecast or other information supplied. You should always seek independent advice as to your suitability to speculate in any related markets and your ability to assume the associated risks, if you are at all unsure. We are not under any obligation to update any such material. Any opinion made may be personal to the author and may not reflect the opinion of StoneX Europe Ltd.