




Make It or Break It for The Australian Dollar
China seems to be back in business after being shut down completely for 2 months.
Share this:

China reported a trade surplus for March earlier today at +19.90B vs -7.09B for the combined January-February period. China seems to be back in business after being shut down completely for 2 months. Additional data will be released later in the week. However, all eyes will now focus on if they can keep the coronavirus at bay, as a few flare ups have developed in a few areas.
Australia relies heavily on China as a trading partner. As such, as the economy of China goes, so does the economy of Australia. Traders have been anticipating China’s improved data for the last month as China began re-opening its factories and the economy. As a result, the Australian Dollar has been moving higher as well.
But now, pairs such as AUD/USD and AUD/JPY are at a point where they need to break though significant resistance to reach their previous February levels, or they will roll over and head lower.
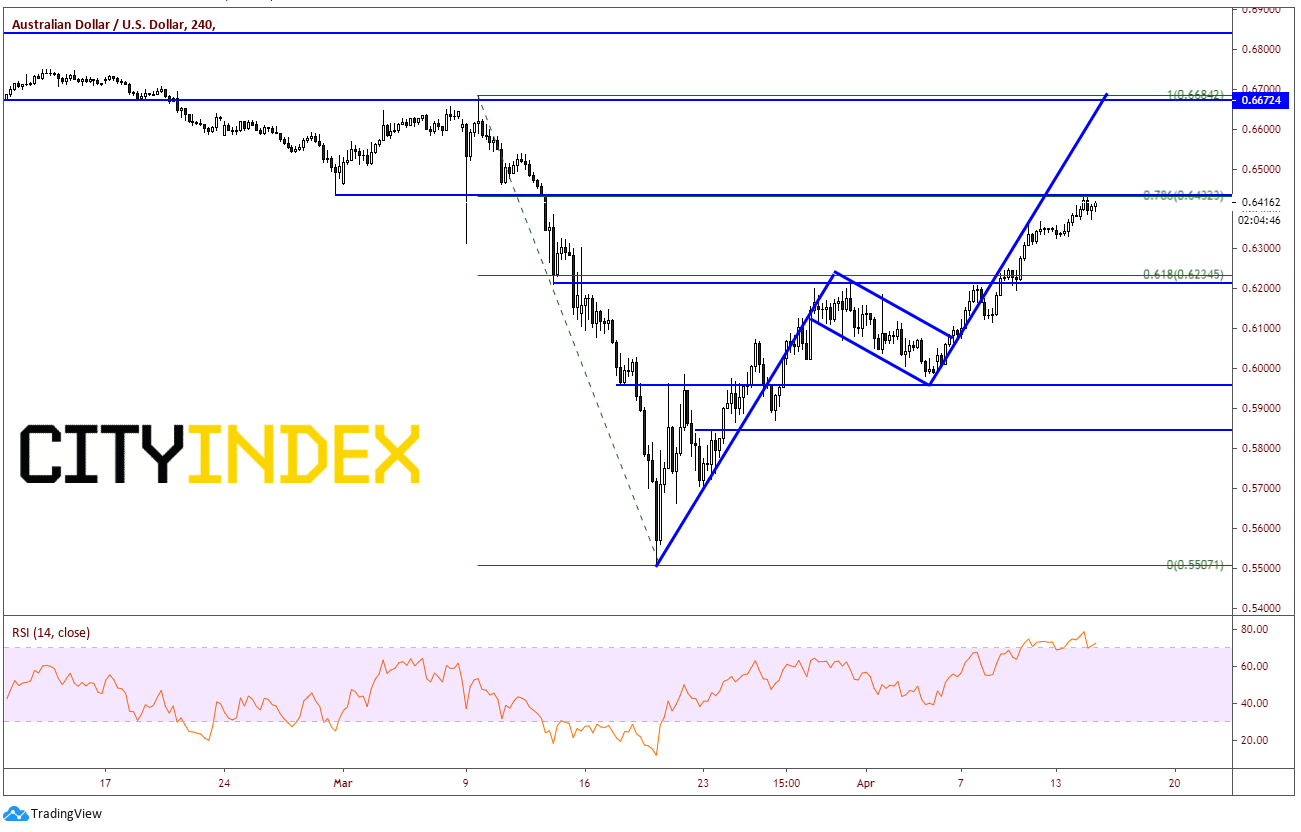
On a 240-minute AUD/USD chart, the pair has broken out of a pennant formation, with a target near the March 9th highs and previous support (now acting as resistance) at February’s lows. However, price has stalled (at the less often looked) at 78.6% Fibonacci retracement level from the March 9th highs to the March 18th lows at .6433. In addition, this level happens to be horizontal resistance. The RSI is also in overbought conditions, however still pointing higher. If AUD/USD can break through .6450, price could run back up to prior highs near .6675. If price fails from here, support is back at the 61.8% retracement levef near .6234/.6250.
Source: Tradingview, City Index
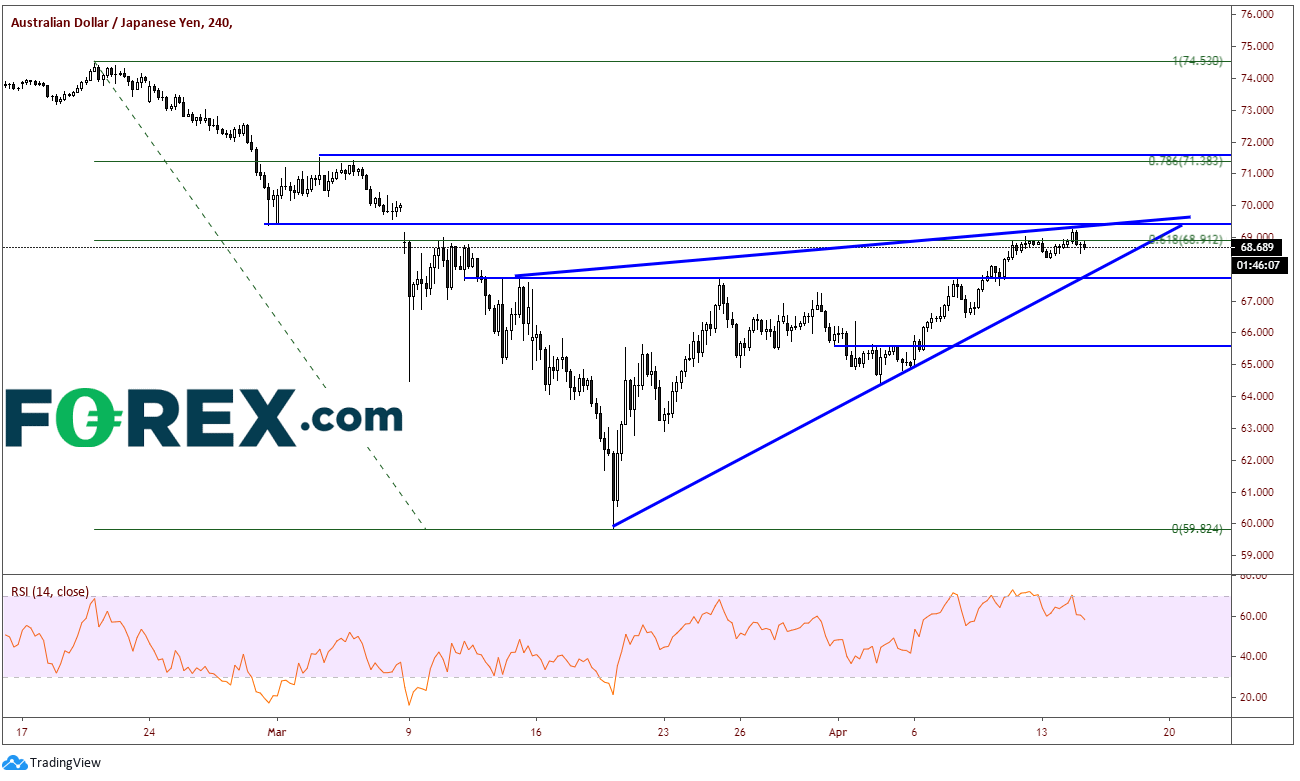
On a 240-minute AUD/JPY chart, there is a similar pattern that has set up. Here, price has traded into the gap from March 9th and is up against horizontal resistance at 69.40. In addition, price has stalled at the 61.8% Fibonacci retracement from the February 20th highs to the March 18th lows. However, price has not yet filled the gap and is trading in an ascending wedge formation. If AUD/JPY can break higher and fill the gap near 69.75, price should be able to run up to horizontal resistance near 71.50 and then a full retracement up to 74.50. If price fails and breaks lower out of the ascending wedge, the target would be a long way down, back to 60.00! There will be a great deal of support along the way though, such as the upward sloping trendline and horizontal support convergence near 67.70 and horizontal support near 65.60.
Source: Tradingview, City Index
The US is also discussing re-opening the economy. If that happens “sooner than later”, equities should also continue to climb, and bring AUD/USD with it. Watch both China and the US for new information regarding the coronavirus to help determine the next direction if the Australian Dollar!
China reported a trade surplus for March earlier today at +19.90B vs -7.09B for the combined January-February period. China seems to be back in business after being shut down completely for 2 months. Additional data will be released later in the week. However, all eyes will now focus on if they can keep the coronavirus at bay, as a few flare ups have developed in a few areas.
Australia relies heavily on China as a trading partner. As such, as the economy of China goes, so does the economy of Australia. Traders have been anticipating China’s improved data for the last month as China began re-opening its factories and the economy. As a result, the Australian Dollar has been moving higher as well.
But now, pairs such as AUD/USD and AUD/JPY are at a point where they need to break though significant resistance to reach their previous February levels, or they will roll over and head lower.
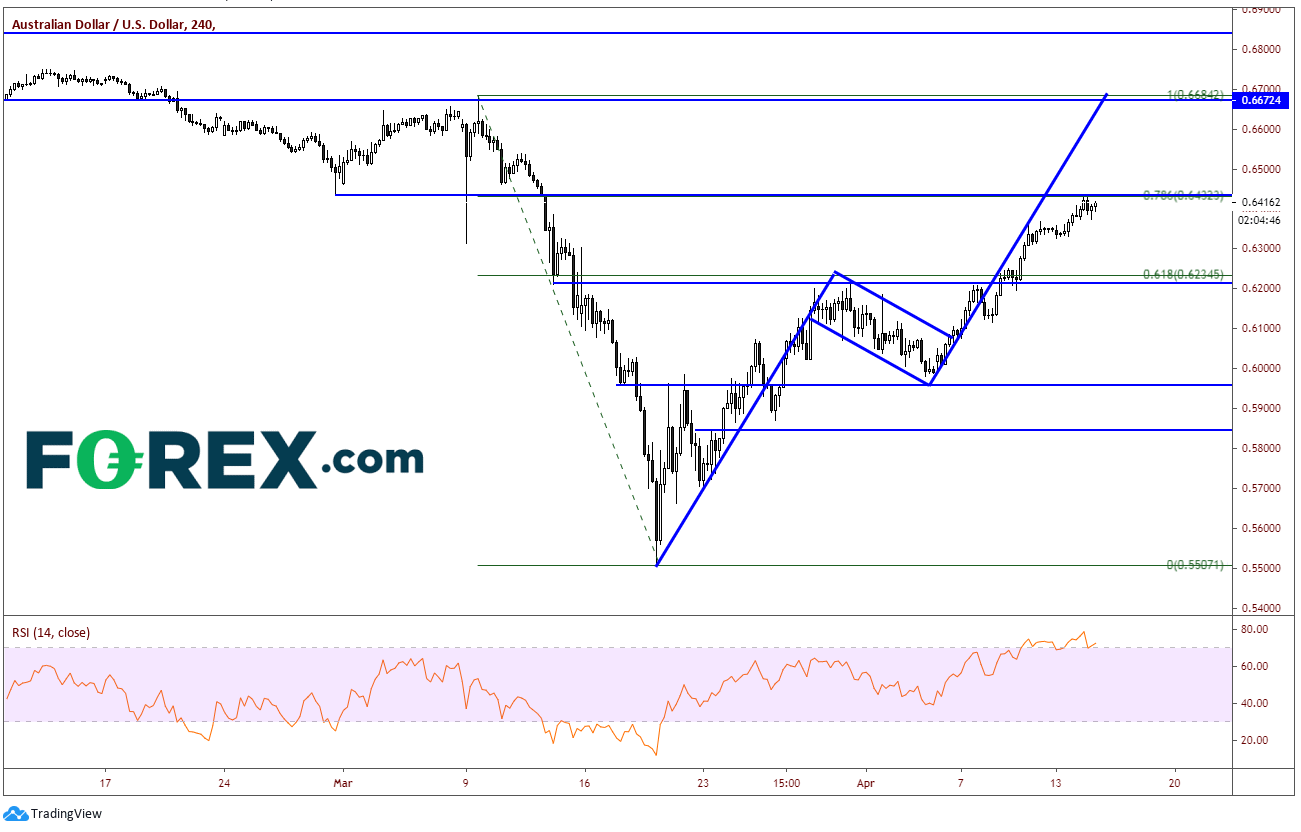
On a 240-minute AUD/USD chart, the pair has broken out of a pennant formation, with a target near the March 9th highs and previous support (now acting as resistance) at February’s lows. However, price has stalled (at the less often looked) at 78.6% Fibonacci retracement level from the March 9th highs to the March 18th lows at .6433. In addition, this level happens to be horizontal resistance. The RSI is also in overbought conditions, however still pointing higher. If AUD/USD can break through .6450, price could run back up to prior highs near .6675. If price fails from here, support is back at the 61.8% retracement levef near .6234/.6250.
Source: Tradingview, FOREX.com
On a 240-minute AUD/JPY chart, there is a similar pattern that has set up. Here, price has traded into the gap from March 9th and is up against horizontal resistance at 69.40. In addition, price has stalled at the 61.8% Fibonacci retracement from the February 20th highs to the March 18th lows. However, price has not yet filled the gap and is trading in an ascending wedge formation. If AUD/JPY can break higher and fill the gap near 69.75, price should be able to run up to horizontal resistance near 71.50 and then a full retracement up to 74.50. If price fails and breaks lower out of the ascending wedge, the target would be a long way down, back to 60.00! There will be a great deal of support along the way though, such as the upward sloping trendline and horizontal support convergence near 67.70 and horizontal support near 65.60.
Source: Tradingview, FOREX.com
The US is also discussing re-opening the economy. If that happens “sooner than later”, equities should also continue to climb, and bring AUD/USD with it. Watch both China and the US for new information regarding the coronavirus to help determine the next direction if the Australian Dollar!




The complete CFD trading experience
Award-winning platforms, competitive spreads, low commissions and dedicated support.
We live and breathe the markets and are dedicated to helping traders realise their ambitions as we continue to set the industry bar.
Economic calendar
Web Trader platform
Our sophisticated web-based platform is packed with features.
Related articles

AUD/USD Analysis: What's Next for the Australian Dollar After the RBA Decision?
Recent trading sessions have reflected a more neutral tone around the Australian dollar. This can be seen in AUD/USD price action, which has posted moves of roughly 0.2% over the last two sessions without establishing a clear direction. Much of this lack of momentum is linked to expectations surrounding the next policy moves from both the Reserve Bank of Australia (RBA) and the Federal Reserve.

AUD/USD Shorts Bear the Brunt of Hot CPI, Renewed RBA Hike Bets
Hot Australian CPI revives RBA hike bets, lifts bond yields and adds fresh pressure to crowded AUD/USD short positions.


Australian Dollar Outlook: Sentiment Rebounds, AUD/USD Nears Resistance
Australian consumer sentiment rebounds sharply, but softer RBA hike expectations and resistance near 0.7140 could test AUD/USD bulls.
StoneX Europe Ltd may make third party material available on this website which may contain information included but not limited to the conditions of financial markets. The material is for information purposes only and does not contain, and should not be construed as containing, investment advice and/or investment recommendation and/or an investment research and/or an offer of or solicitation for any transactions in financial instruments; any decision to enter into a specific transaction shall be made by the client following an assessment by him/her of their situation.
StoneX Europe Ltd makes no representation or warranty and assumes no liability as to the accuracy or completeness of the information provided, nor any loss arising from any investment based on a recommendation, forecast or other information supplied. You should always seek independent advice as to your suitability to speculate in any related markets and your ability to assume the associated risks, if you are at all unsure. We are not under any obligation to update any such material. Any opinion made may be personal to the author and may not reflect the opinion of StoneX Europe Ltd.