



Nasdaq 100 Analysis: The Index Rebounds After Tariff Suspension
Although the Nasdaq 100 started the session with a clear bearish bias, it showed a solid recovery toward the close, posting gains of more than 1.8% and moving back toward the 25,500-point area.
Share this:

Although the Nasdaq 100 started the session with a clear bearish bias, it showed a solid recovery toward the close, posting gains of more than 1.8% and moving back toward the 25,500-point area. This renewed buying pressure emerged after the announcement of the cancellation of potential tariffs on Europe, which helped restore market confidence and allowed the index to regain ground in the short term. As long as this improvement in sentiment persists, buying pressure could remain dominant over the coming sessions.


Tensions ease
Over recent sessions, market commentary had intensified around the possibility of tariffs on Europe, initially expected to start at around 10% from February 1. However, following a series of meetings held in Davos, President Donald Trump announced that certain agreements had been reached and confirmed the cancellation of the proposed tariffs, after establishing a framework for security cooperation with NATO.
The removal of these tariffs, after several days of diplomatic tensions, has been received as a relief for short-term market confidence. This shift has allowed risk appetite to strengthen once again. As the Nasdaq 100 is considered a risk asset, the recovery in confidence has been directly reflected in its short-term price action, as tensions ease in a meaningful way.
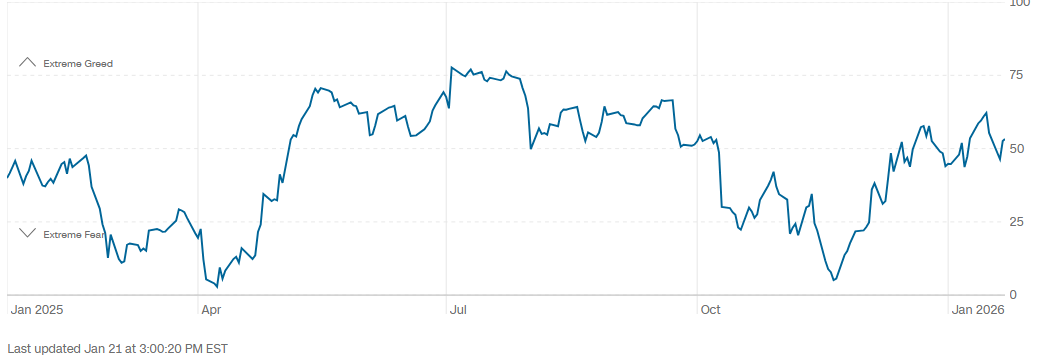
In fact, this improvement in sentiment is already visible in the Fear and Greed Index, which measures overall market confidence. The index has rebounded quickly toward the 53-point area, moving back into neutral territory, while displaying an upward slope that brings it closer to the “greed” zone. This rebound has been reinforced as tariff-related threats toward Europe were withdrawn, signaling a sustained recovery in short-term market confidence.
Source: CNN
With this in mind, the reduction in diplomatic tensions has allowed short-term confidence to strengthen again, supporting an environment where risk appetite can be sustained. As long as no new surprises emerge and tensions do not resurface in the coming sessions, the buying pressure that has begun to develop in the Nasdaq 100 could remain relevant in the short term.
Long-term confidence
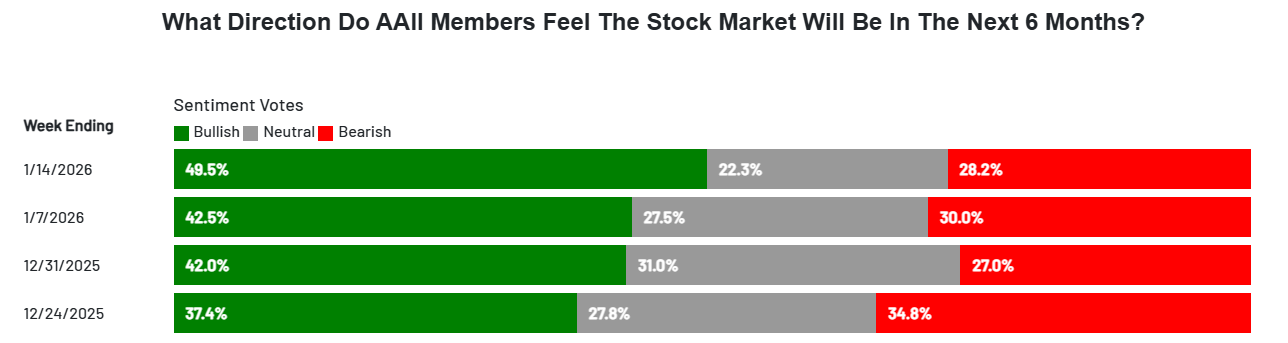
In addition to the recovery in short-term confidence, long-term sentiment indicators have also started to improve. According to the AAII Investor Sentiment Survey, 49.5% of investors currently hold a positive outlook for the U.S. equity market over the next six months. Meanwhile, 22.3% remain neutral and 28.2% maintain a pessimistic view. While these figures do not reflect overwhelming optimism, they do point to a gradual recovery in long-term confidence.
Source: AAII
As the AAII confidence index continues to show steady week-to-week improvement, this trend could reinforce long-term demand stability for equity indices such as the Nasdaq. In this context, long-term confidence may become an additional factor supporting more consistent buying pressure over the coming weeks.
Nasdaq 100 Technical Outlook
Source: StoneX, Tradingview
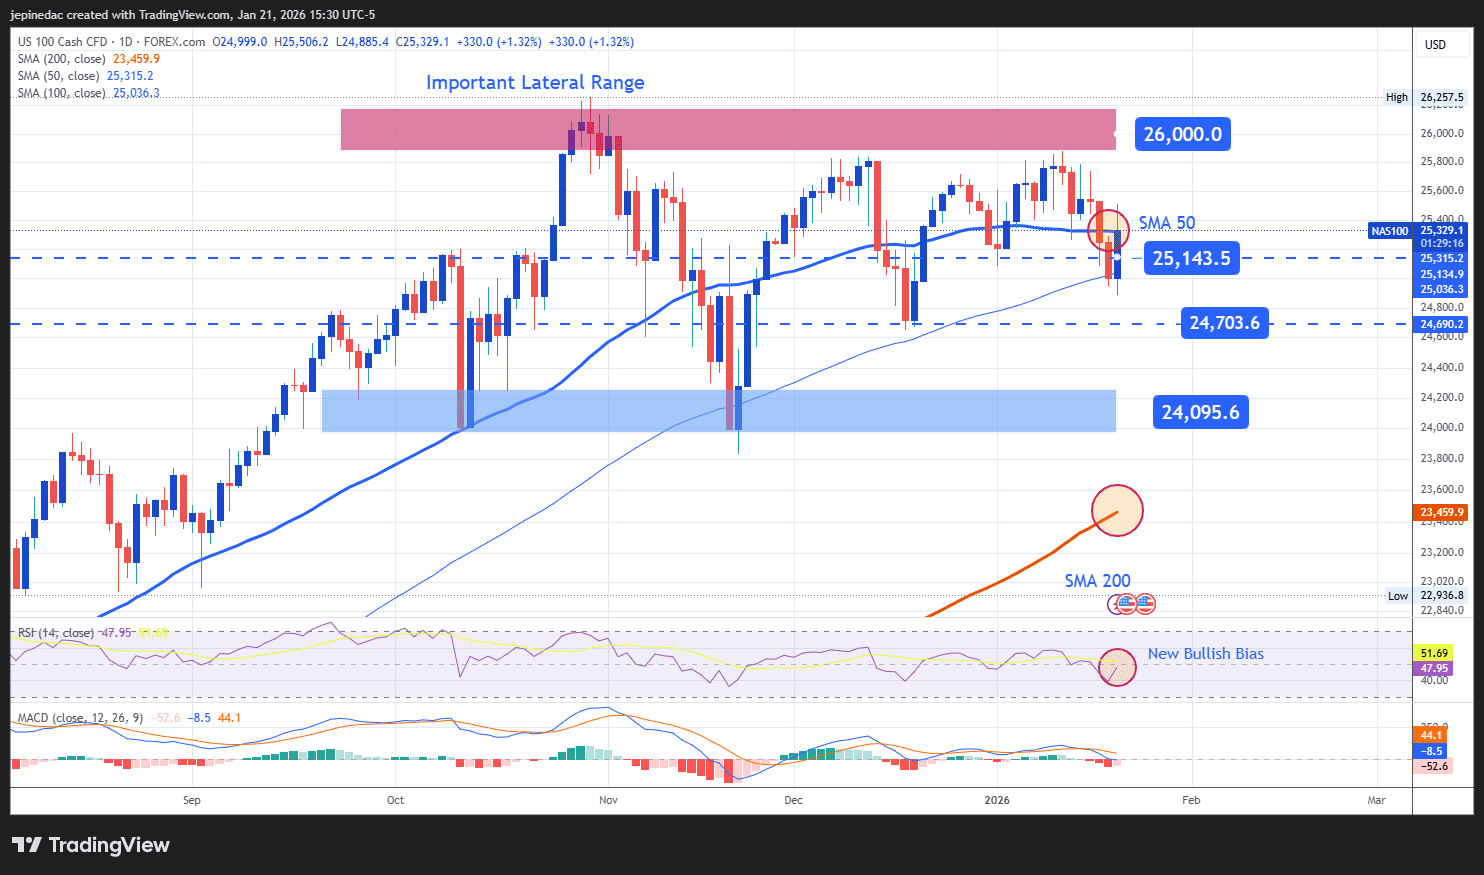
- Sideways range remains dominant: Despite the recent rebound, the Nasdaq continues to face the technical structure of a broad sideways range, capped near 26,000 points and supported around 24,000 points. As long as price remains within this zone, it will be difficult to see the formation of a more clearly defined trend in the short term.
- RSI: The RSI has managed to move back above the neutral 50 level, indicating that buying momentum has regained control when considering price action over the last 14 sessions. If the indicator maintains this upward slope, it could continue to support short-term buying pressure.
- MACD: The MACD histogram is approaching the zero line, and a sustained crossover above this level could signal bullish dominance in short-term moving averages. This scenario could further reinforce consistent buying pressure in the sessions ahead.
Key levels:
- 26,000 points – Key resistance: This level aligns with the Nasdaq’s all-time highs and represents the most important upside barrier. A sustained breakout above this zone could reactivate a stronger bullish bias and open the door to a new upward trend over the coming weeks.
- 25,140 points – Nearby barrier: A neutral zone located near the midpoint of the sideways range and aligned with the 50-period simple moving average. Prolonged price action around this level could reinforce a consolidation scenario.
- 24,700 points – Key support: This level corresponds to the lows of recent weeks and represents the main support area to monitor. A pullback toward this zone could reactivate downside pressure and open space for renewed selling in the short term.
Written by Julian Pineda, CFA, CMT – Market Analyst
Follow him on: @julianpineda25
Latest market news




The complete CFD trading experience
Award-winning platforms, competitive spreads, low commissions and dedicated support.
We live and breathe the markets and are dedicated to helping traders realise their ambitions as we continue to set the industry bar.
Economic calendar
Web Trader platform
Our sophisticated web-based platform is packed with features.
Related articles
RBA delivers 25bp hike, Bullock now the main event
The RBA delivered the expected 25bp hike, but Bullock’s press conference now looms as the bigger volatility risk for AUD/USD and the ASX 200.

Nasdaq 100 Forecast: NDX falls as oil jumps and Treasury yields rise
U.S. stocks are pointing to a weaker open on Monday after President Trump rejected an Iranian ceasefire, sending oil prices higher and fuelling inflationary concerns and pushing Treasury yields higher.


S&P 500, Nasdaq, Dow Forecast: Wall Street Split Widens Into Month-End 9 26 2026
Nasdaq strength contrasts with mounting Dow pressure as rising Treasury yields raise the stakes for stocks heading into the monthly close.

StoneX Europe Ltd may make third party material available on this website which may contain information included but not limited to the conditions of financial markets. The material is for information purposes only and does not contain, and should not be construed as containing, investment advice and/or investment recommendation and/or an investment research and/or an offer of or solicitation for any transactions in financial instruments; any decision to enter into a specific transaction shall be made by the client following an assessment by him/her of their situation.
StoneX Europe Ltd makes no representation or warranty and assumes no liability as to the accuracy or completeness of the information provided, nor any loss arising from any investment based on a recommendation, forecast or other information supplied. You should always seek independent advice as to your suitability to speculate in any related markets and your ability to assume the associated risks, if you are at all unsure. We are not under any obligation to update any such material. Any opinion made may be personal to the author and may not reflect the opinion of StoneX Europe Ltd.