



Nasdaq 100 Analysis: The Index Reclaims the 25,000 Level
Despite starting the week with a consistent neutral tone, today’s session saw the Nasdaq post gains of more than 1% in the short term. The move was mainly driven by the strong performance of its key components and by the reduced relative attractiveness of substitute assets such as U.S. Treasury bonds.
Share this:

Despite starting the week with a consistent neutral tone, today’s session saw the Nasdaq post gains of more than 1% in the short term. The move was mainly driven by the strong performance of its key components and by the reduced relative attractiveness of substitute assets such as U.S. Treasury bonds. These factors have acted as relevant catalysts for renewed buying pressure that is beginning to consolidate.
If this renewed confidence persists, it could contribute to more sustained buying pressure in the coming sessions.


Confidence Attempts to Return to the Market
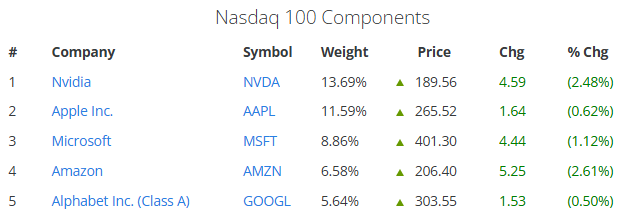
The outlook for Nasdaq has turned more positive, largely due to the performance of its main components, which are posting notable gains in the current session. Nvidia is up 2.48%, Apple advances 0.62%, Microsoft gains 1.12%, Amazon leads with 2.61%, and Google also posts a moderate increase of 0.5%.
This behavior suggests that confidence has returned to the index’s leading components, a relevant factor considering these five stocks account for more than 40% of the Nasdaq’s weighting.
Source: Slickcharts
The recent momentum is partly explained by an announcement involving Nvidia, which reported a strategic agreement with Meta Platforms to supply millions of artificial intelligence chips for large-scale data centers. This development has renewed confidence not only in Nvidia’s stock but also in broader technology sector prospects, indirectly benefiting other major components of the index.
The event is significant because part of the recent pullback in technology stocks was linked to uncertainty surrounding AI investment. This new announcement provides greater clarity regarding the continuation and consolidation of strategic projects within the industry, which has been interpreted as a positive signal by the market. If this renewed sentiment holds, it could continue to support stronger buying pressure in Nasdaq in the coming sessions.
Bonds begin to lose appeal
In addition to the strength in technology stocks, another relevant factor has been the reduced attractiveness of the fixed-income market. When bond yields decline, equities may regain relative appeal, as capital flows tend to seek alternative exposure in indices such as the Nasdaq.
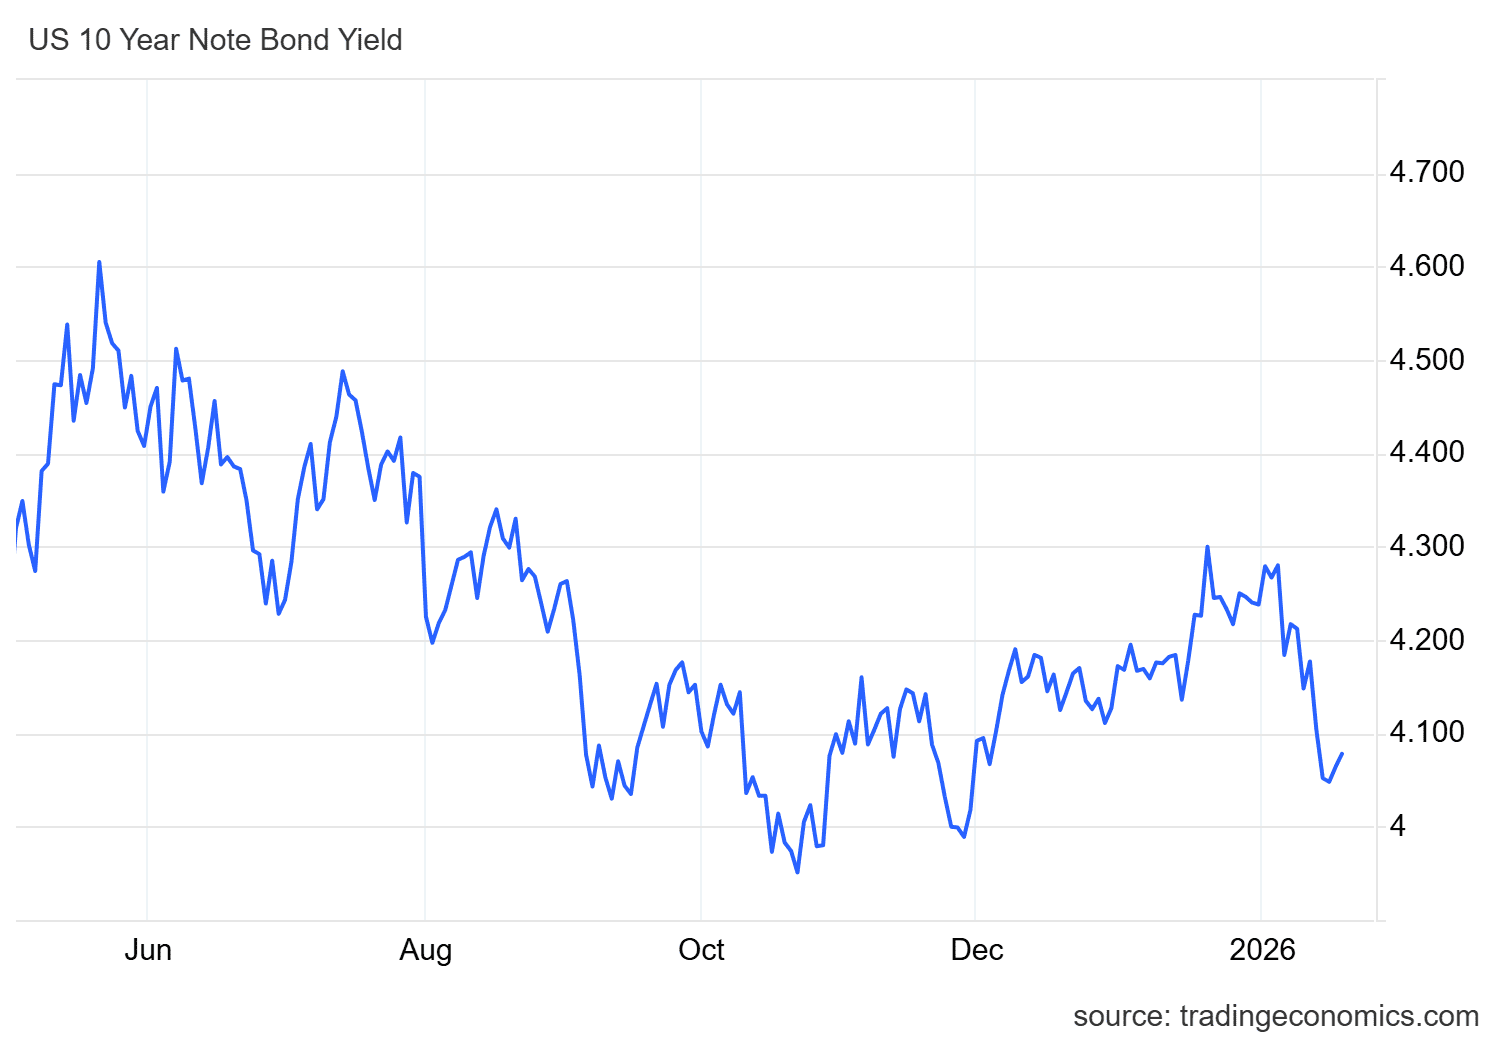
U.S. 10-year Treasury yields have shown a consistent decline, now hovering slightly above the 4.00% level, well below the recent high near 4.3%. This drop in yields reduces the relative appeal of fixed income and may encourage rotation into higher-risk assets.
Source: TradingEconomics
If this weakness in bond yields persists, it could continue to narrow the relative advantage of fixed income over equities. In that scenario, part of the capital flows may keep rotating toward equity indices such as the Nasdaq, indirectly supporting more consistent buying pressure in upcoming sessions.
Nasdaq Technical Outlook

Source: StoneX, Tradingview
- The Sideways Range Continues to Dominate: Despite the recent recovery, the Nasdaq remains within a broad sideways range, bounded by resistance near 26,000 points and support around 24,000 points. As long as price action remains within this structure, it will be difficult to establish a more clearly defined directional trend.
- RSI: The RSI remains close to the neutral 50 level, indicating that short-term buying and selling momentum is balanced. This suggests an ongoing indecision phase unless a more decisive move emerges.
- MACD: A similar pattern is visible in the MACD, where the histogram fluctuates around the zero line, signaling a lack of clear direction in short-term moving averages. This reinforces the dominant neutral bias in recent index behavior.
Key Levels:
- 26,000 points – Key resistance: A level aligned with the Nasdaq’s historical highs and representing the main upside barrier. A sustained breakout above this area could reactivate a stronger bullish bias and open the door to a new upward trend in the coming weeks.
- 24,600 points – Near-term barrier: A neutrality zone aligned with recent lows. Price action hovering near this level could prolong the current sideways range.
- 24,100 points – Key support: A level corresponding to recent weekly lows and the main downside area to monitor. A pullback toward this zone could reactivate weakness and open space for renewed selling pressure, potentially triggering a more meaningful short-term downtrend.
Written by Julian Pineda, CFA, CMT – Market Analyst
Follow him on: @julianpineda25
Related tags:
Latest market news



The complete CFD trading experience
Award-winning platforms, competitive spreads, low commissions and dedicated support.
We live and breathe the markets and are dedicated to helping traders realise their ambitions as we continue to set the industry bar.
Economic calendar
Web Trader platform
Our sophisticated web-based platform is packed with features.
Related articles

Equity Indices Q4, 2026 Outlook: Cracks Begin to Show
There's still an open door for a melt-up in the S&P 500 and Nasdaq but the Dow and Russell 2000 are looking more vulnerable, and until calm hits the Treasuries market there's a higher probability for volatility. The big question is whether that's a next quarter theme or not.


S&P 500 forecast: Stocks extend drop as correction risks grow
US and global equity markets have extended Wednesday’s sell-off, with Wall Street opening lower after a weak handover from Asia and Europe. The deterioration in risk appetite has been spreading across global markets. The dollar was firmer, Treasury yields were holding onto yesterday’s gains, while gold, silver and bitcoin were all under pressure alongside equities and major currencies.

EUR/USD, Nasdaq Price Outlook: Reversal Risks Build
EUR/USD and Nasdaq Price Outlook: Overbought/oversold momentum on hourly and daily time frames is raising reversal risks across the U.S. dollar, EUR/USD and Nasdaq after a strong weekly advance.

StoneX Europe Ltd may make third party material available on this website which may contain information included but not limited to the conditions of financial markets. The material is for information purposes only and does not contain, and should not be construed as containing, investment advice and/or investment recommendation and/or an investment research and/or an offer of or solicitation for any transactions in financial instruments; any decision to enter into a specific transaction shall be made by the client following an assessment by him/her of their situation.
StoneX Europe Ltd makes no representation or warranty and assumes no liability as to the accuracy or completeness of the information provided, nor any loss arising from any investment based on a recommendation, forecast or other information supplied. You should always seek independent advice as to your suitability to speculate in any related markets and your ability to assume the associated risks, if you are at all unsure. We are not under any obligation to update any such material. Any opinion made may be personal to the author and may not reflect the opinion of StoneX Europe Ltd.