



Nasdaq 100: Key levels to watch every 1,000 points
There are key levels of previous support and resistance to watch roughly every 1,000 points - see what they are!
Share this:

After just dodging a “bear market” intraday decline of -20% (at least so far) to start the year, the widely-followed Nasdaq 100 index (US Tech 100) has stabilized in choppy trade below 15,000 over the last week.
Fundamentally speaking, the big factor driving the tech-heavy index in recent weeks has been earnings. Looking at just the most heavily-weighted components of the index, we’ve seen earnings reports beating expectations at Apple, Microsoft, Amazon, Alphabet, and Tesla, though these gains were partially offset by big misses from Meta and Netflix. Nvidia, with a 3.9% weighting in the index, is expected to report earnings on Wednesday, February 16th after the bell.
The other key fundamental driver to watch when trading the Nasdaq 100 is interest rates. As traders price in the potential for more aggressive interest rate hikes from the Federal Reserve, we’ve seen the yield on the benchmark 10-year treasury bond surge from under 1.40% at the start of Christmas week to approach 2.00% this week. As a reminder, rising yields increase the cost of capital for companies and make bonds a (slightly) more compelling alternative for investment funds than equities. While we doubt many traders are directly selling their shares in fast-growing tech behemoths like Apple and Amazon to buy a government bond yielding less than 2%, this shift nonetheless influences flows at the margin.
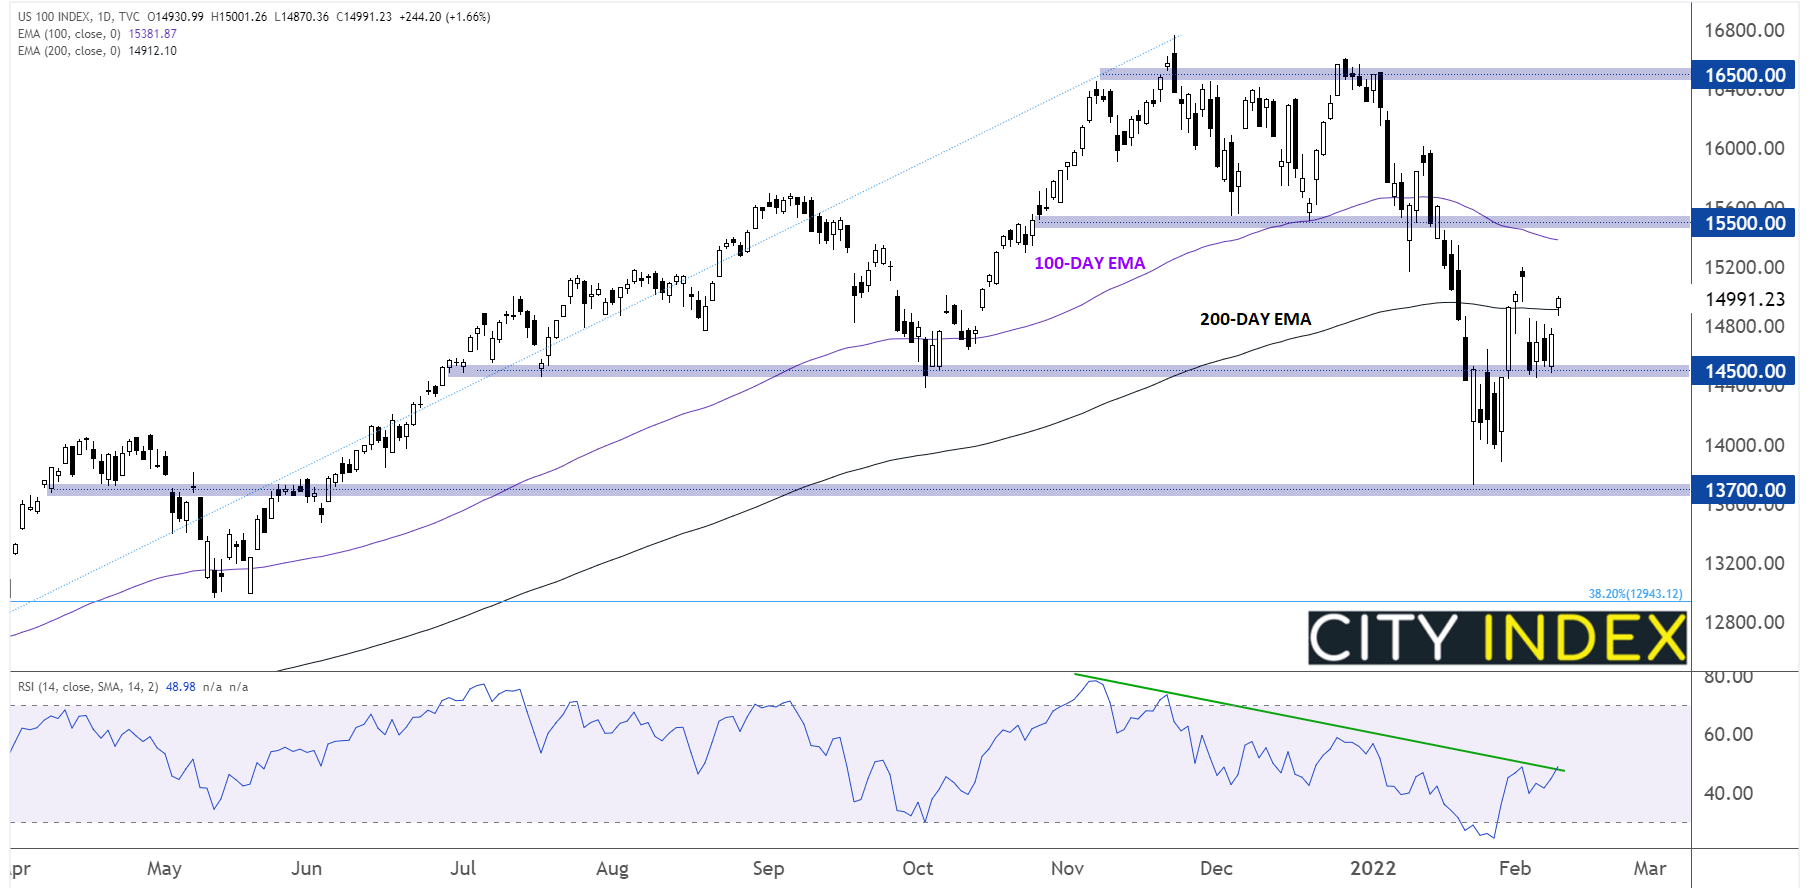
In any event, the Nasdaq 100 index is trading up by more than 1.5% on the day to regain its 200-day EMA and test the 15,000 area. Moving forward, there are key levels of previous support and resistance to watch roughly every 1,000 points:
- 16,500: Major resistance near the all-time highs
- 15,500: Previous-support-turned-resistance from December and January
- 14,500: Previous support dating back to July, as well as this week’s low
- 13,700: The year-to-date low

Source: TradingView, StoneX
Short-term traders may want to mark these levels on their charts and use them as levels to frame trades around in the days and weeks to come (e.g. look for sell opportunities if the index rallies to 15,500, or buy if it breaks above, targeting the next level at 16,500, etc). By understanding the key signposts along the way, traders can keep their bearings and stay on track, even amidst market volatility.
How to trade with FOREX.com
Follow these easy steps to start trading with FOREX.com today:
- Open a Forex.com account, or log-in if you’re already a customer.
- Search for the market you want to trade in our award-winning platform.
- Choose your position and size, and your stop and limit levels.
- Place the trade.
After just dodging a “bear market” intraday decline of -20% (at least so far) to start the year, the widely-followed Nasdaq 100 index (US Tech 100) has stabilized in choppy trade below 15,000 over the last week.
Fundamentally speaking, the big factor driving the tech-heavy index in recent weeks has been earnings. Looking at just the most heavily-weighted components of the index, we’ve seen earnings reports beating expectations at Apple, Microsoft, Amazon, Alphabet, and Tesla, though these gains were partially offset by big misses from Meta and Netflix. Nvidia, with a 3.9% weighting in the index, is expected to report earnings on Wednesday, February 16th after the bell.
The other key fundamental driver to watch when trading the Nasdaq 100 is interest rates. As traders price in the potential for more aggressive interest rate hikes from the Federal Reserve, we’ve seen the yield on the benchmark 10-year treasury bond surge from under 1.40% at the start of Christmas week to approach 2.00% this week. As a reminder, rising yields increase the cost of capital for companies and make bonds a (slightly) more compelling alternative for investment funds than equities. While we doubt many traders are directly selling their shares in fast-growing tech behemoths like Apple and Amazon to buy a government bond yielding less than 2%, this shift nonetheless influences flows at the margin.
In any event, the Nasdaq 100 index is trading up by more than 1.5% on the day to regain its 200-day EMA and test the 15,000 area. Moving forward, there are key levels of previous support and resistance to watch roughly every 1,000 points:
- 16,500: Major resistance near the all-time highs
- 15,500: Previous-support-turned-resistance from December and January
- 14,500: Previous support dating back to July, as well as this week’s low
- 13,700: The year-to-date low
Source: TradingView, StoneX
Short-term traders may want to mark these levels on their charts and use them as levels to frame trades around in the days and weeks to come (e.g. look for sell opportunities if the index rallies to 15,500, or buy if it breaks above, targeting the next level at 16,500, etc). By understanding the key signposts along the way, traders can keep their bearings and stay on track, even amidst market volatility.
How to trade with City Index
You can trade with City Index by following these four easy steps:
- Open an account, or log in if you’re already a customer
• Open an account in the UK
• Open an account in Australia
• Open an account in Singapore
- Search for the company you want to trade in our award-winning platform
- Choose your position and size, and your stop and limit levels
- Place the trade
Related tags:
Latest market news




The complete CFD trading experience
Award-winning platforms, competitive spreads, low commissions and dedicated support.
We live and breathe the markets and are dedicated to helping traders realise their ambitions as we continue to set the industry bar.
Economic calendar
Web Trader platform
Our sophisticated web-based platform is packed with features.
Related articles
S&P 500, Nasdaq, Dow Forecast: Wall Street Split Widens Into Month-End 9 26 2026
Nasdaq strength contrasts with mounting Dow pressure as rising Treasury yields raise the stakes for stocks heading into the monthly close.

EUR/USD weekly outlook: Oil, inflation and NFP in focus
After coming under significant pressure in recent weeks, the EUR/USD came off its lows to finish the week on a positive note on Friday, albeit with only a mild rebound. That was not enough to prevent the exchange rate falling for the third consecutive week, as the US dollar and bond yields rallied across the board.

Gold Q4 2026 outlook: Resilience in the face of rallying dollar and yields
As we headed towards the latter stages of Q3 and into Q4, the Fed had just hiked rates in a hawkish FOMC meeting, while the likes of the ECB and BoJ had also tightened their respective policies. Oil prices remained elevated amid the prolonged US-Iran conflict. Meanwhile, bond yields were breaking out, and the dollar was higher across the board. Yet, remarkably, gold was still holding in the positive territory for the third quarter, even if it had weakened somewhat in September.
StoneX Europe Ltd may make third party material available on this website which may contain information included but not limited to the conditions of financial markets. The material is for information purposes only and does not contain, and should not be construed as containing, investment advice and/or investment recommendation and/or an investment research and/or an offer of or solicitation for any transactions in financial instruments; any decision to enter into a specific transaction shall be made by the client following an assessment by him/her of their situation.
StoneX Europe Ltd makes no representation or warranty and assumes no liability as to the accuracy or completeness of the information provided, nor any loss arising from any investment based on a recommendation, forecast or other information supplied. You should always seek independent advice as to your suitability to speculate in any related markets and your ability to assume the associated risks, if you are at all unsure. We are not under any obligation to update any such material. Any opinion made may be personal to the author and may not reflect the opinion of StoneX Europe Ltd.