





Nasty NFP Numbers
The NFP number was -20,500,000 vs an expected -21,000,000 and a revised -870,000
Share this:

The headline Nonfarm Payrolls number was -20,500,000 vs an expected -21,000,000 and a revised -870,000 for March. At any other point in time a 500,000 difference between the estimated and actual would have been a huge difference. However, these days, the actual number was considered roughly in line with expectations. The Unemployment Rate skyrocketed from 4.4% in March to 14.7% in April. Perhaps the most disturbing data point though is the increase in average hourly earnings, which rose from 0.5% in March to 4.7% in April vs an expectation of 0.4%. This substantial rise is largely due to job losses of lower paid workers and increases in pay for those that were kept. The Average Hourly Earnings figure is an important data point for the Fed when gauging inflation. It will be extremely important moving forward to determine if this turns out to be inflationary or just a “one off” event.
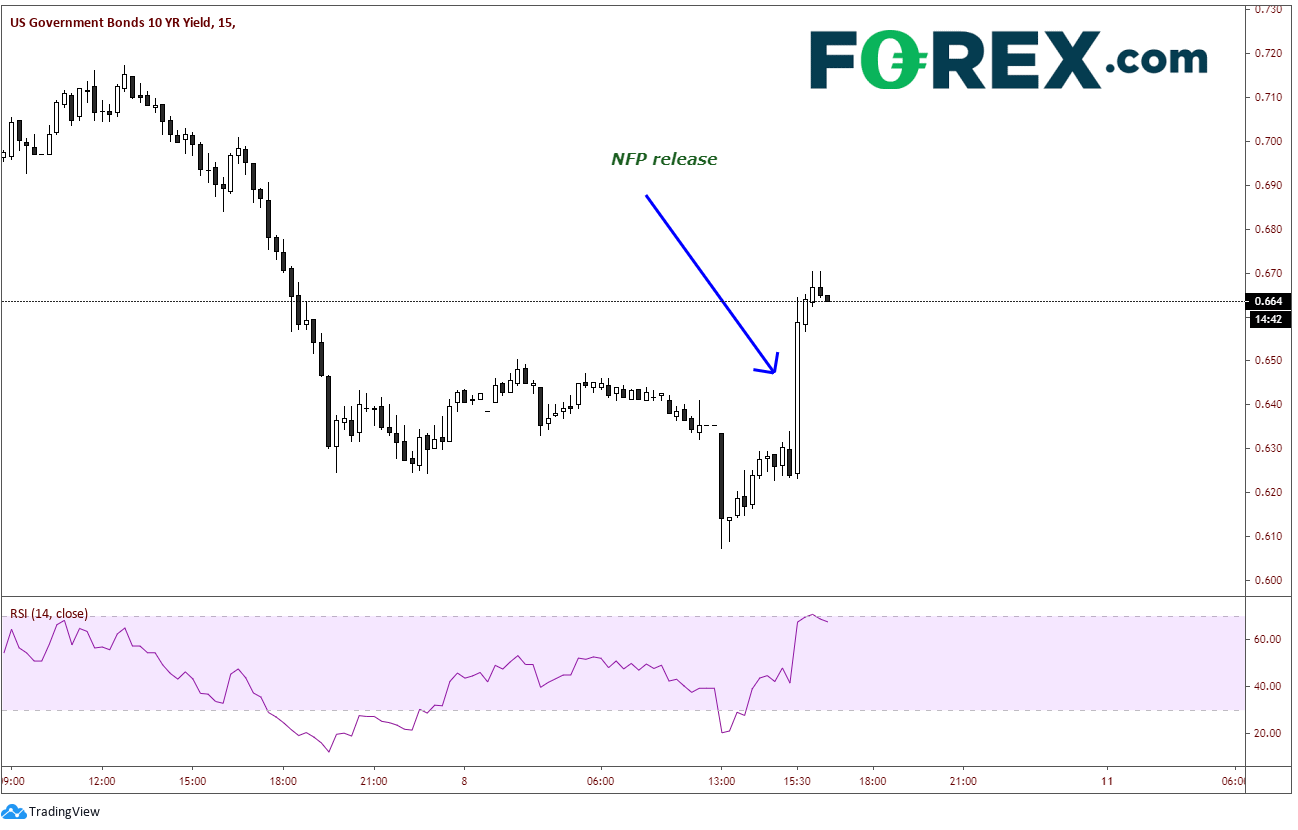
With the headline NFP number close to expectations, yields and the US Dollar went bid on the data release as fears of possible inflation may have been the initial reaction. 10 Year Yields moved from 0.62% to 0.66%.
Source: Tradingview, City Index
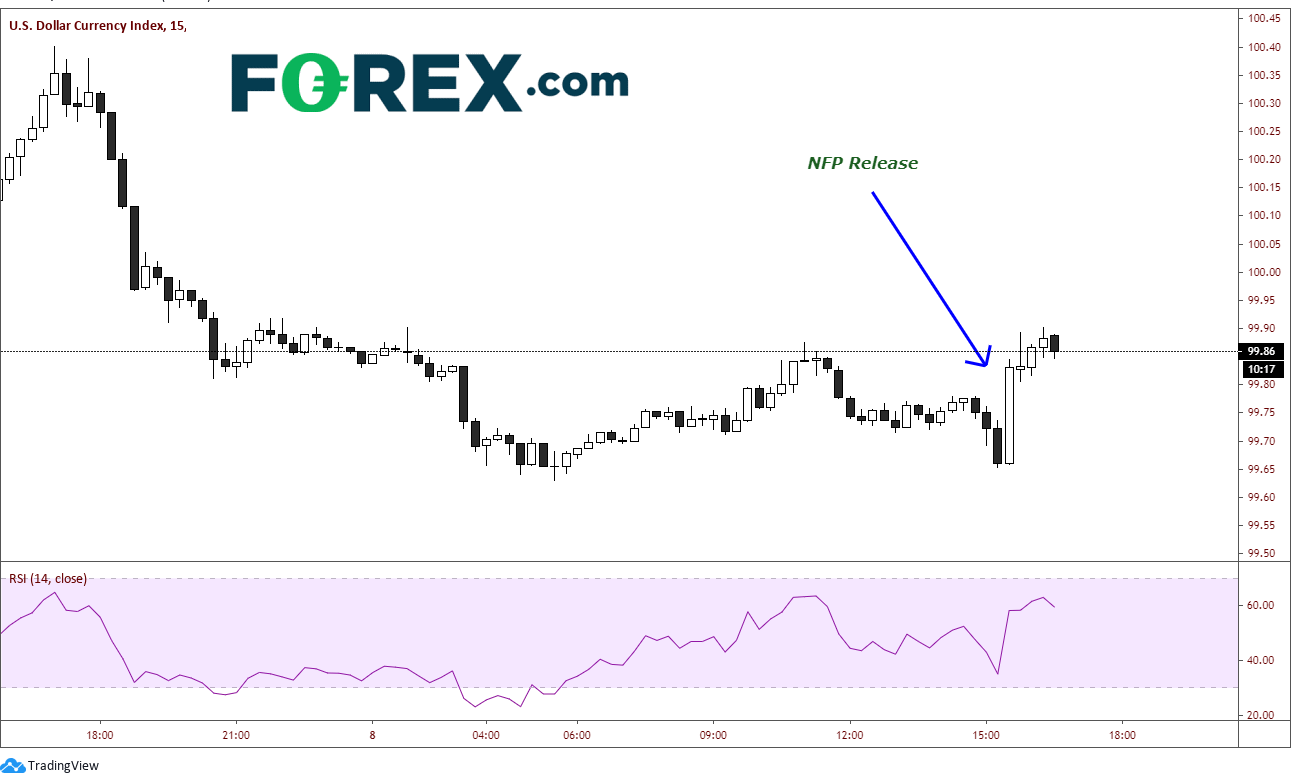
The DXY went bid as well, moving higher from 99.66 to 99.85.
Source: Tradingview, City Index
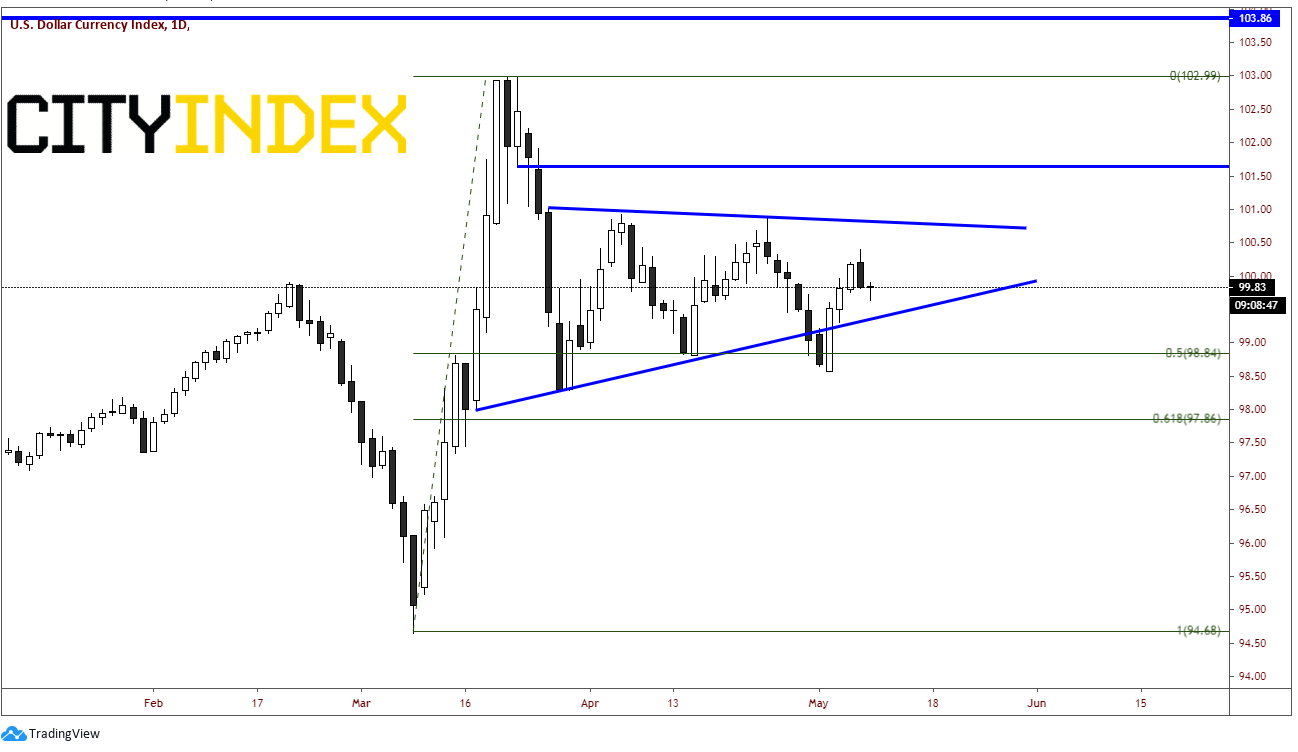
The US Dollar Index is currently in a symmetrical triangle pattern on a daily timeframe, recovering from a false breakdown on May 1st. Support is at the lower trendline of the triangle near 99.38, then Monday’s lows at 98.57. The 61.8% Fibonacci retracement level from the March 9th lows to the March 23rd highs comes across below there at 97.86. If the DXY continues to move higher, first resistance is yesterday’s high at 100.40. Above there is the high from April 24th and the upper trendline from the triangle at 100.83. Horizontal resistance then comes in at 101.65.
Source: Tradingview, City Index
Today’s close with will be key for the DXY. If the index can close above 100.32, it will create a bullish engulfing candle which would signal further upside for the US Dollar.
The most important thing to take away from today’s NFP data is that it was only 1 month of data points. The data was very bad. If the job numbers continue to come in poorly and the average hourly earnings continue to increase over the next few months, then the Fed will have its work cut out for them!
The headline Nonfarm Payrolls number was -20,500,000 vs an expected -21,000,000 and a revised -870,000 for March. At any other point in time a 500,000 difference between the estimated and actual would have been a huge difference. However, these days, the actual number was considered roughly in line with expectations. The Unemployment Rate skyrocketed from 4.4% in March to 14.7% in April. Perhaps the most disturbing data point though is the increase in average hourly earnings, which rose from 0.5% in March to 4.7% in April vs an expectation of 0.4%. This substantial rise is largely due to job losses of lower paid workers and increases in pay for those that were kept. The Average Hourly Earnings figure is an important data point for the Fed when gauging inflation. It will be extremely important moving forward to determine if this turns out to be inflationary or just a “one off” event.
With the headline NFP number close to expectations, yields and the US Dollar went bid on the data release as fears of possible inflation may have been the initial reaction. 10 Year Yields moved from 0.62% to 0.66%.
Source: Tradingview, FOREX.com
The DXY went bid as well, moving higher from 99.66 to 99.85.
Source: Tradingview, FOREX.com
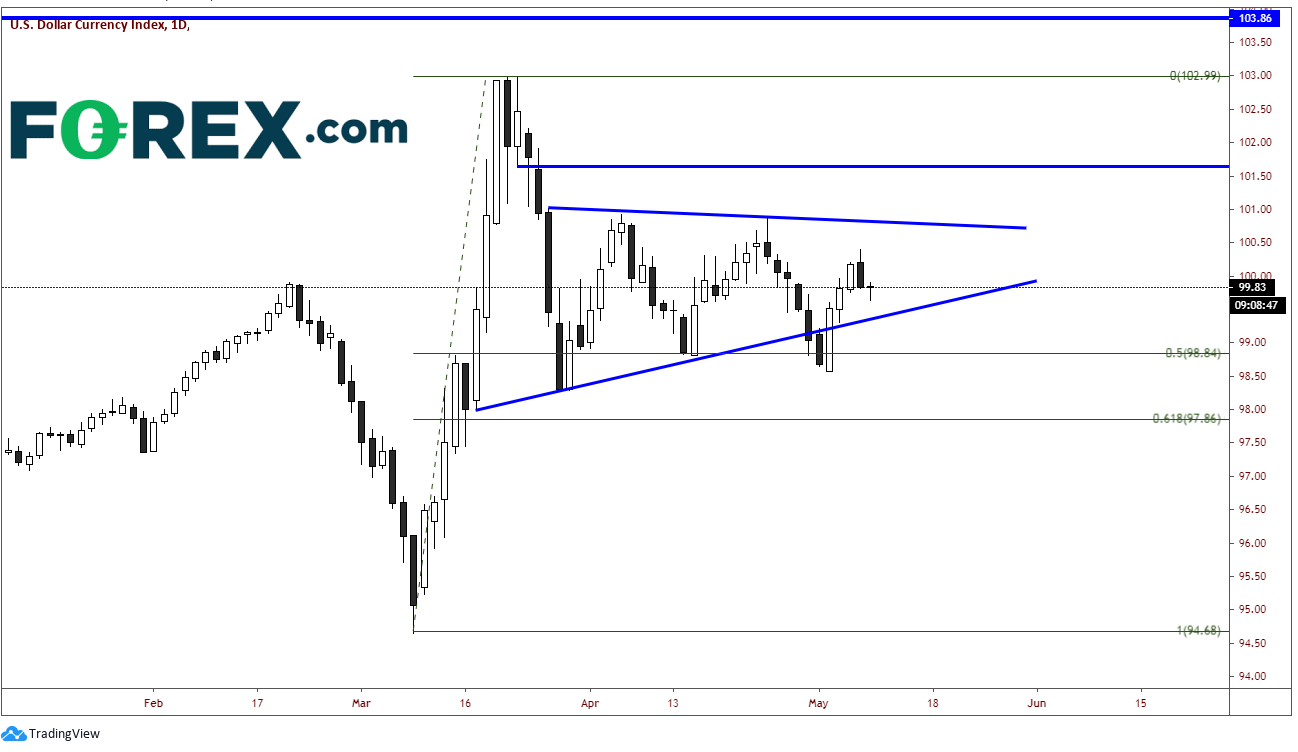
The US Dollar Index is currently in a symmetrical triangle pattern on a daily timeframe, recovering from a false breakdown on May 1st. Support is at the lower trendline of the triangle near 99.38, then Monday’s lows at 98.57. The 61.8% Fibonacci retracement level from the March 9th lows to the March 23rd highs comes across below there at 97.86. If the DXY continues to move higher, first resistance is yesterday’s high at 100.40. Above there is the high from April 24th and the upper trendline from the triangle at 100.83. Horizontal resistance then comes in at 101.65.
Source: Tradingview, FOREX.com
Today’s close with will be key for the DXY. If the index can close above 100.32, it will create a bullish engulfing candle which would signal further upside for the US Dollar.
The most important thing to take away from today’s NFP data is that it was only 1 month of data points. The data was very bad. If the job numbers continue to come in poorly and the average hourly earnings continue to increase over the next few months, then the Fed will have its work cut out for them!
Latest market news




The complete CFD trading experience
Award-winning platforms, competitive spreads, low commissions and dedicated support.
We live and breathe the markets and are dedicated to helping traders realise their ambitions as we continue to set the industry bar.
Economic calendar
Web Trader platform
Our sophisticated web-based platform is packed with features.
Related articles
EUR/USD Q4 2026 Outlook: Euro at a Crossroads as Fed, ECB Tighten 9 25 2026
EUR/USD enters Q4 at a pivotal inflection point as competing Fed-ECB policy paths and persistent inflation risks collide with major technical support.

USD/JPY Q4 2026 Outlook: Hawkish Fed Pricing Clashes With Intervention Risk
The year-end tug-of-war is clear: hawkish Fed pricing supports USD/JPY, while intervention risk limits the upside.


Japanese Yen Forecast: USD/JPY 4% Rally Challenges Post-Intervention Downtrend 9 24 2026
USD/JPY momentum has shifted sharply higher, putting a major resistance confluence in focus as U.S. and Japanese event risk builds.
StoneX Europe Ltd may make third party material available on this website which may contain information included but not limited to the conditions of financial markets. The material is for information purposes only and does not contain, and should not be construed as containing, investment advice and/or investment recommendation and/or an investment research and/or an offer of or solicitation for any transactions in financial instruments; any decision to enter into a specific transaction shall be made by the client following an assessment by him/her of their situation.
StoneX Europe Ltd makes no representation or warranty and assumes no liability as to the accuracy or completeness of the information provided, nor any loss arising from any investment based on a recommendation, forecast or other information supplied. You should always seek independent advice as to your suitability to speculate in any related markets and your ability to assume the associated risks, if you are at all unsure. We are not under any obligation to update any such material. Any opinion made may be personal to the author and may not reflect the opinion of StoneX Europe Ltd.