


Nikkei 225 signals flash bearish as BOJ hawkish bets build
Technical signals and fundamentals are aligning against Japanese stocks. A bearish engulfing candle and evening star pattern point lower, while BOJ rate hike speculation adds fuel to the fire.
Share this:

- Bearish chart signals warn of downside risk
- Key support zone near 50DMA and April uptrend in focus
- Break below support opens path to 48,400 and lower targets
- BOJ hawkish bets push yields higher, adding equity headwinds
Summary
Japanese equities face a potent mix of technical and fundamental pressure. Bearish chart signals point to growing downside risks, with key support levels now in play. At the same time, BOJ hawkish bets have driven bond yields to fresh cycle highs, narrowing rate differentials and boosting the yen. If these trends persist, the headwinds for stocks could intensify, making the coming sessions critical for direction.
Bearish Chart Signals Emerge…
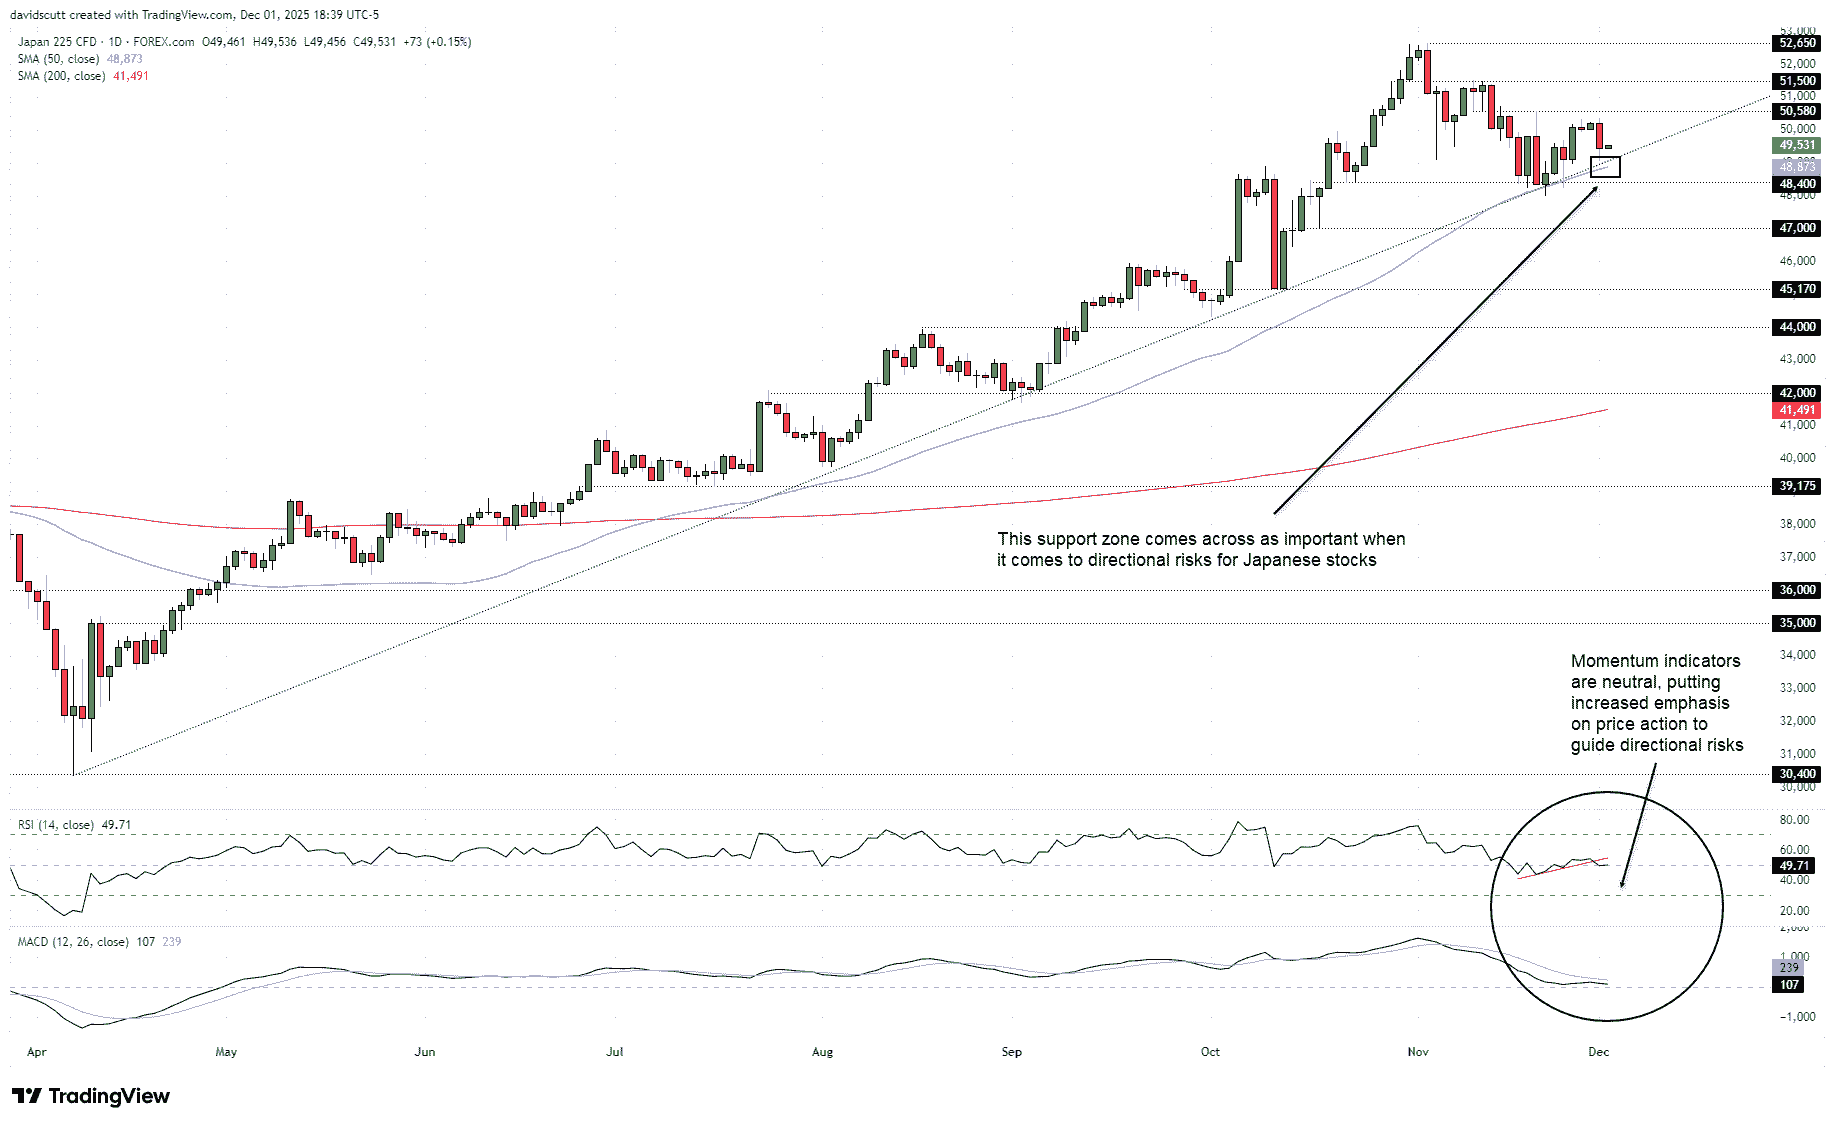
A bearish engulfing candle on our Japan 225 contract coincides with an obvious three-candle evening star pattern in futures, delivering a double dose of bearish signals that point to growing downside risks for Japanese stocks.
Source: TradingView
Currently, long-running uptrend support dating back to the April lows and the 50DMA are in close proximity beneath where the contract trades, making that a key support zone to focus on should the signals from the price action prove reliable.
If we see a clean break and close beneath the zone, it would allow for shorts to be established with a stop above the 50DMA to protect against reversal, targeting 48,400 support initially. If that gives way, 47,000, 45,170 and 42,000 were levels that saw plenty of price action either side earlier in the year, putting them on the radar as targets should we see a sustained unwind.
Of course, if the support zone comprising the 50DMA and uptrend support holds, it would allow for long setups to be considered, targeting 50,580 and 51,500 resistance initially. A stop beneath the 50DMA would protect against reversal.
RSI (14) and MACD are delivering neutral signals, a departure from what was seen in recent months when upside strength was dominant. While both indicators are gradually moving towards bearish territory right now, the preference remains to let price action and signals determine how to proceed.
…As Macro Headwinds Build
Fundamentally, you can’t escape that markets interpreted Monday’s speech from Bank of Japan governor Ueda as mildly hawkish, seeing traders move to price in the risk of a 25 basis point hike on December 19 at around 80%. That saw large parts of the Japanese government bond curve rupture higher, with yields for two, five, 10 and 20-year tenors hitting fresh cycle highs, helping underpin gains in the Japanese yen as relative interest rate differentials narrowed with other nations.
Should the trends from Monday continue, it points to mounting headwinds for Japanese equities, both from a valuation and earnings perspective given how many constituents in the Nikkei derive a large share of revenues from offshore. If the move in JGBs and yen stalls, it may act as a release valve that temporarily reduces downside risks for stocks.
Latest market news




The complete CFD trading experience
Award-winning platforms, competitive spreads, low commissions and dedicated support.
We live and breathe the markets and are dedicated to helping traders realise their ambitions as we continue to set the industry bar.
Economic calendar
Web Trader platform
Our sophisticated web-based platform is packed with features.
Related articles
USD/JPY outlook: Hawkish Fed recalibration pressures the yen
Stronger US growth momentum and rising Treasury yields are keeping USD/JPY pointed higher, even as Japanese policymakers try to limit the pressure building across domestic markets.
Gold, silver slammed as hawkish Fed repricing reignites dollar upside
Gold and silver had held up surprisingly well against surging US yields. Wednesday’s DXY breakout may have changed that equation.
Euro Short-term Outlook: EUR/USD Selloff Nears Critical Yearly Support 9 23 2026
Euro has fallen seven of the past nine sessions, with stretched momentum raising the stakes as EUR/USD closes in on a major inflection zone.

StoneX Europe Ltd may make third party material available on this website which may contain information included but not limited to the conditions of financial markets. The material is for information purposes only and does not contain, and should not be construed as containing, investment advice and/or investment recommendation and/or an investment research and/or an offer of or solicitation for any transactions in financial instruments; any decision to enter into a specific transaction shall be made by the client following an assessment by him/her of their situation.
StoneX Europe Ltd makes no representation or warranty and assumes no liability as to the accuracy or completeness of the information provided, nor any loss arising from any investment based on a recommendation, forecast or other information supplied. You should always seek independent advice as to your suitability to speculate in any related markets and your ability to assume the associated risks, if you are at all unsure. We are not under any obligation to update any such material. Any opinion made may be personal to the author and may not reflect the opinion of StoneX Europe Ltd.