




Puttin on the VIX
With all this negativity one may think that the VIX is near record highs.
Share this:

I reside in the United States, in a state that has a high number of coronavirus cases. It doesn’t seem like there is any end in sight. Throughout the US 4 weeks of initial claims data show that nearly 22,000,000 people have applied for unemployment benefits. There is unprecedented Monetary Policy action abd fiscal deficits at or near all-time highs. We are at the beginning or earnings season, and thus far it hasn’t been pretty. Forward guidance has been significantly lowered or removed altogether. People aren’t back to work. Schools haven’t reopened. Granted, AMZN is trading at record highs and NFLX is right with it (No surprise, given the lockdowns). But companies such as GE are near lows not seen since 1992! Has the market priced in too much of an economic recovery too soon? Stock traders seem to have the mentality of “Things Can’t get Any Worse”.
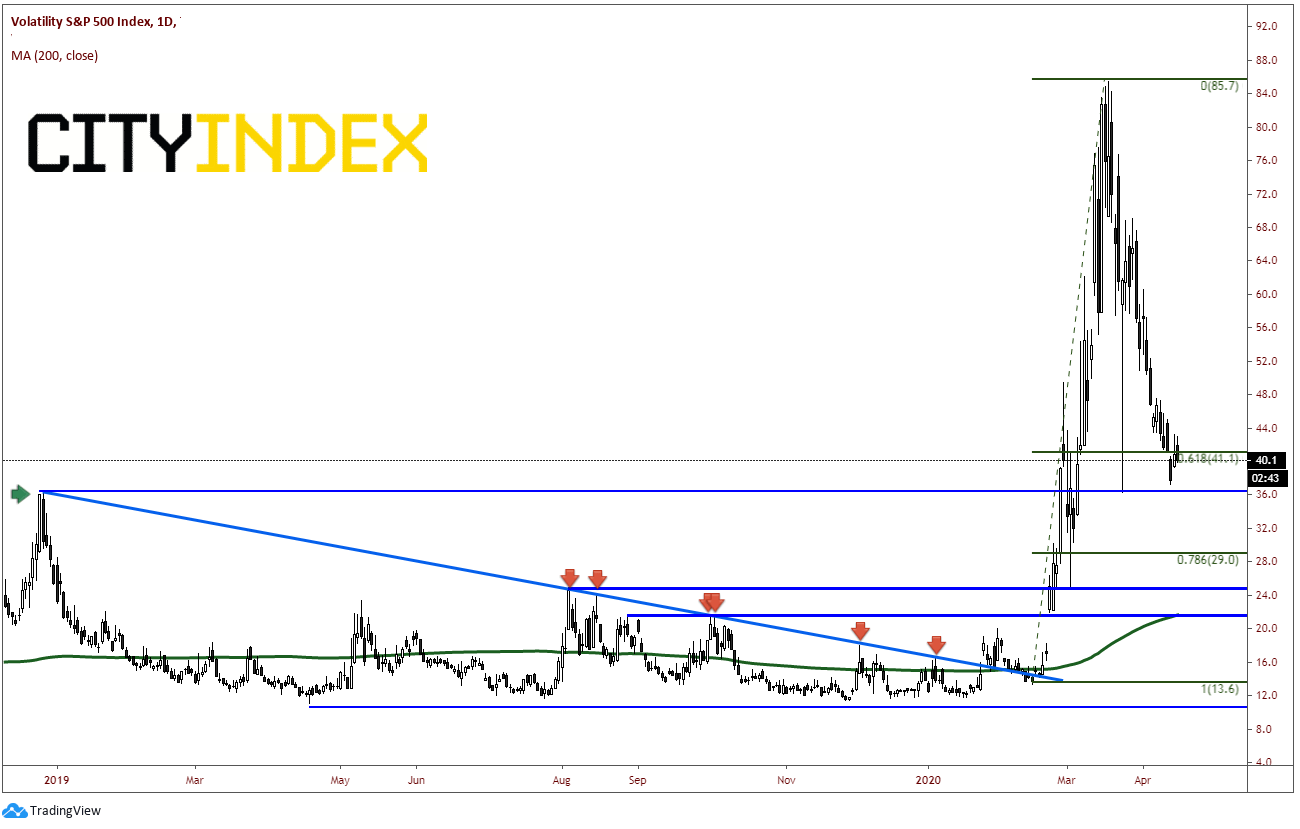
With all this negativity one may think that the VIX is near record highs. However, that is hardly the case. On a daily timeframe, the VIX is trading at 40.10 and has stalled at the 61.8% Fibonacci retracement level from the lows on February to the highs on March 18th. There is also horizontal support at 36.20, which were the highs from December 2018 and the flash crash VIX spike lows from March 24th. Could this be the place where the VIX turns higher?
Source: Tradingview, City Index
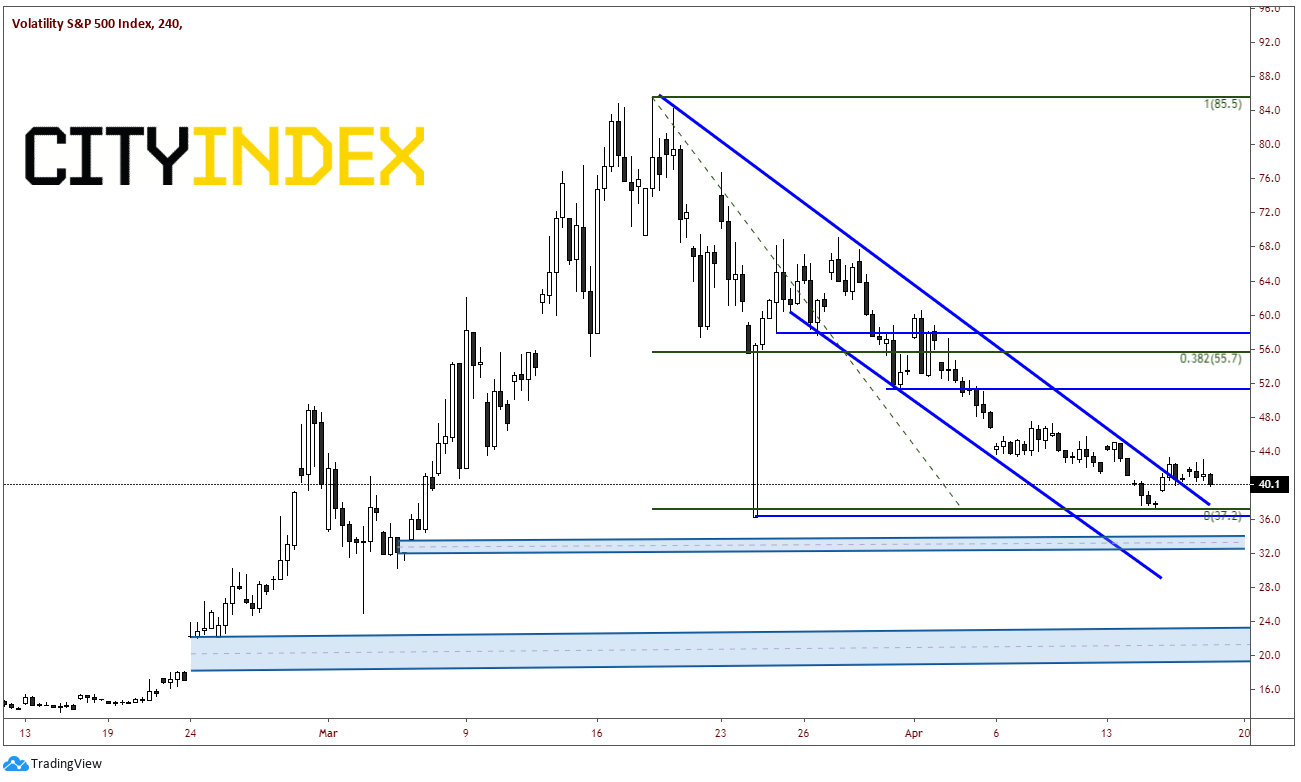
On a 240-minute timeframe, VIX has been trading in a consistent downward sloping channel since March 25th, however the top trendline of the channel extends back to the highs on March 18th at 85.5. Yesterday, price moved above that trendline. Horizontal support crosses at that trendline near 36.40. Below there is a gap from 33.5 down to 32.10, and then an additional gap further down from 22.10 to 18.20. If the low is truly in from Tuesday, then first horizontal resistance is at 51.20. After that is the 38.2% Fibonacci retracement from the March 18th highs to Tuesdays lows at 55.70. If price breaks above there, the next level of resistance is at 58.0.
Source: Tradingview, City Index
If the VIX does trade higher to those resistance levels, stocks will have held current resistance now and turned lower. Traders thus will have realized that stocks have gone too far, too fast. However, if the VIX continues lower, then perhaps things ARE getting better???
I reside in the United States, in a state that has a high number of coronavirus cases. It doesn’t seem like there is any end in sight. Throughout the US 4 weeks of initial claims data show that nearly 22,000,000 people have applied for unemployment benefits. There is unprecedented Monetary Policy action abd fiscal deficits at or near all-time highs. We are at the beginning or earnings season, and thus far it hasn’t been pretty. Forward guidance has been significantly lowered or removed altogether. People aren’t back to work. Schools haven’t reopened. Granted, AMZN is trading at record highs and NFLX is right with it (No surprise, given the lockdowns). But companies such as GE are near lows not seen since 1992! Has the market priced in too much of an economic recovery too soon? Stock traders seem to have the mentality of “Things Can’t get Any Worse”.
With all this negativity one may think that the VIX is near record highs. However, that is hardly the case. On a daily timeframe, the VIX is trading at 40.10 and has stalled at the 61.8% Fibonacci retracement level from the lows on February to the highs on March 18th. There is also horizontal support at 36.20, which were the highs from December 2018 and the flash crash VIX spike lows from March 24th. Could this be the place where the VIX turns higher?
Source: Tradingview, Forex.com
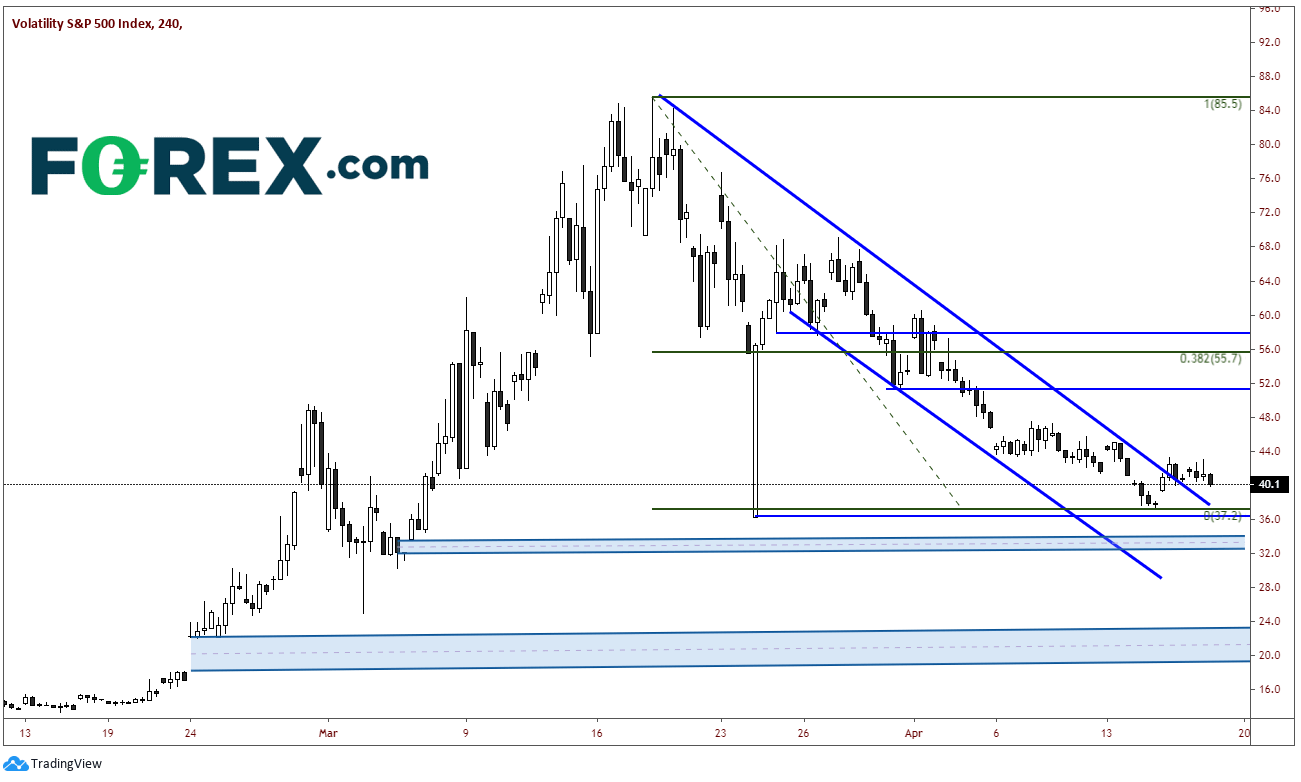
On a 240-minute timeframe, VIX has been trading in a consistent downward sloping channel since March 25th, however the top trendline of the channel extends back to the highs on March 18th at 85.5. Yesterday, price moved above that trendline. Horizontal support crosses at that trendline near 36.40. Below there is a gap from 33.5 down to 32.10, and then an additional gap further down from 22.10 to 18.20. If the low is truly in from Tuesday, then first horizontal resistance is at 51.20. After that is the 38.2% Fibonacci retracement from the March 18th highs to Tuesdays lows at 55.70. If price breaks above there, the next level of resistance is at 58.0.
Source: Tradingview, Forex.com
If the VIX does trade higher to those resistance levels, stocks will have held current resistance now and turned lower. Traders thus will have realized that stocks have gone too far, too fast. However, if the VIX continues lower, then perhaps things ARE getting better???
Latest market news




The complete CFD trading experience
Award-winning platforms, competitive spreads, low commissions and dedicated support.
We live and breathe the markets and are dedicated to helping traders realise their ambitions as we continue to set the industry bar.
Economic calendar
Web Trader platform
Our sophisticated web-based platform is packed with features.
Related articles
EUR/USD Q4 2026 Outlook: Euro at a Crossroads as Fed, ECB Tighten 9 25 2026
EUR/USD enters Q4 at a pivotal inflection point as competing Fed-ECB policy paths and persistent inflation risks collide with major technical support.

USD/JPY Q4 2026 Outlook: Hawkish Fed Pricing Clashes With Intervention Risk
The year-end tug-of-war is clear: hawkish Fed pricing supports USD/JPY, while intervention risk limits the upside.


Japanese Yen Forecast: USD/JPY 4% Rally Challenges Post-Intervention Downtrend 9 24 2026
USD/JPY momentum has shifted sharply higher, putting a major resistance confluence in focus as U.S. and Japanese event risk builds.
StoneX Europe Ltd may make third party material available on this website which may contain information included but not limited to the conditions of financial markets. The material is for information purposes only and does not contain, and should not be construed as containing, investment advice and/or investment recommendation and/or an investment research and/or an offer of or solicitation for any transactions in financial instruments; any decision to enter into a specific transaction shall be made by the client following an assessment by him/her of their situation.
StoneX Europe Ltd makes no representation or warranty and assumes no liability as to the accuracy or completeness of the information provided, nor any loss arising from any investment based on a recommendation, forecast or other information supplied. You should always seek independent advice as to your suitability to speculate in any related markets and your ability to assume the associated risks, if you are at all unsure. We are not under any obligation to update any such material. Any opinion made may be personal to the author and may not reflect the opinion of StoneX Europe Ltd.