



Russell 2000 may continue to underperform
If markets resume the recent trend lower, the Russell 2000 is likely to lead the way!
Share this:

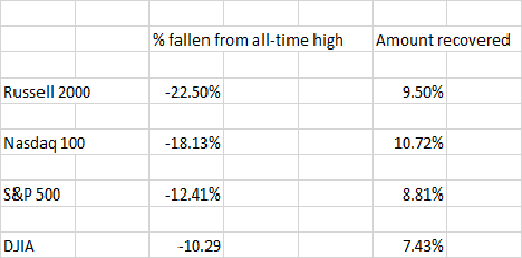
Out of the 4 major US Indices (SPX 500, Nasdaq 100, DJIA, Russell 2000), the Russell 2000 performed the worst on the since falling from all-time highs in November 2021. The small cap stock index fell into bear market territory , down over 22.5% from its all-time highs. Thus far, the Russell 2000 has regained 9.5%. See the chart below for comparison:
Source: Stone X
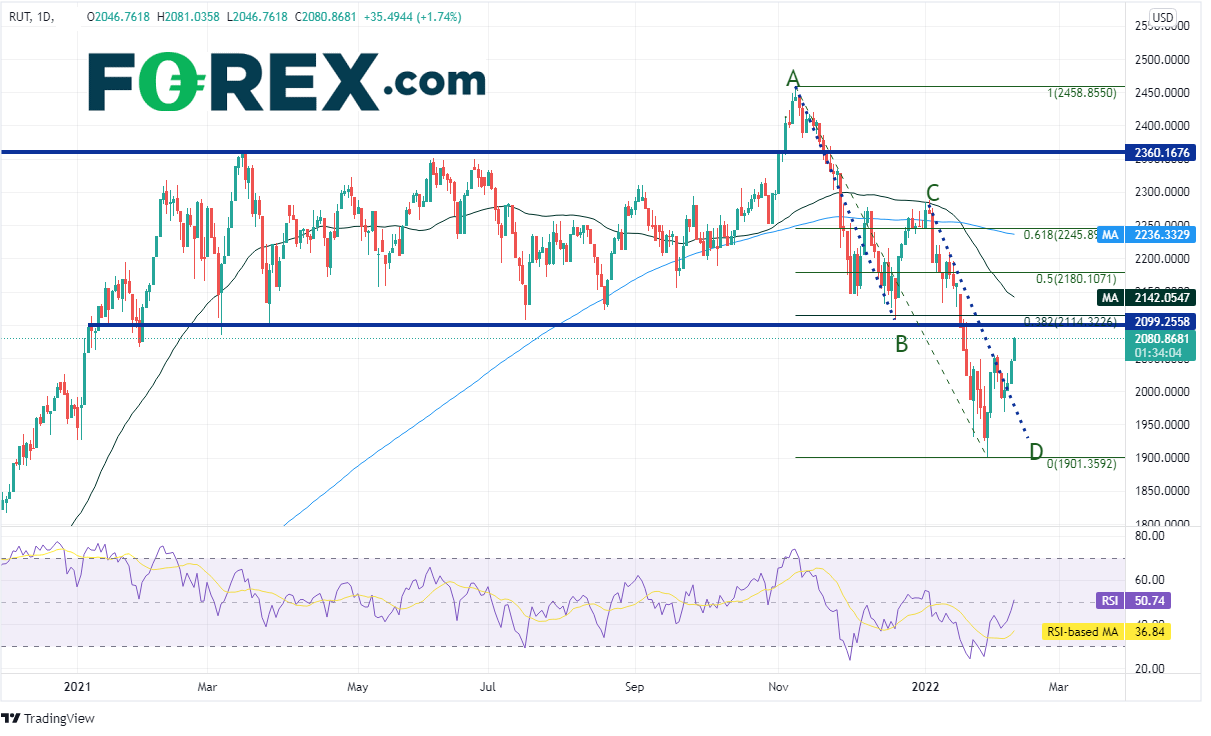
The Russell 2000 had been trading in a range between 2100 and 2360 for nearly all of 2021. In early November 2021, the small cap index broke above the channel and reached an all-time high of 2458.85 before reversing and moving back into the range. The Russell 2000 traded down to 2144.32 and bounced. This set up an AB=CD pattern (which was complete on January 27th). As is often the case, what happens on a false breakout on one side of a channel happens on the other side of the channel. Price eventually broke lower below the bottom channel line on January 19th and traded down to 1901.36, before bouncing. However, whereas the other indices have retraced AT LEAST to the 38.2% Fibonacci retracement from their all-time highs (the S&P 500 and DJIA are at their 61.8% Fibonacci retracement), the Russell 2000 has yet to come close to it yet.
Source: Tradingview, Stone X
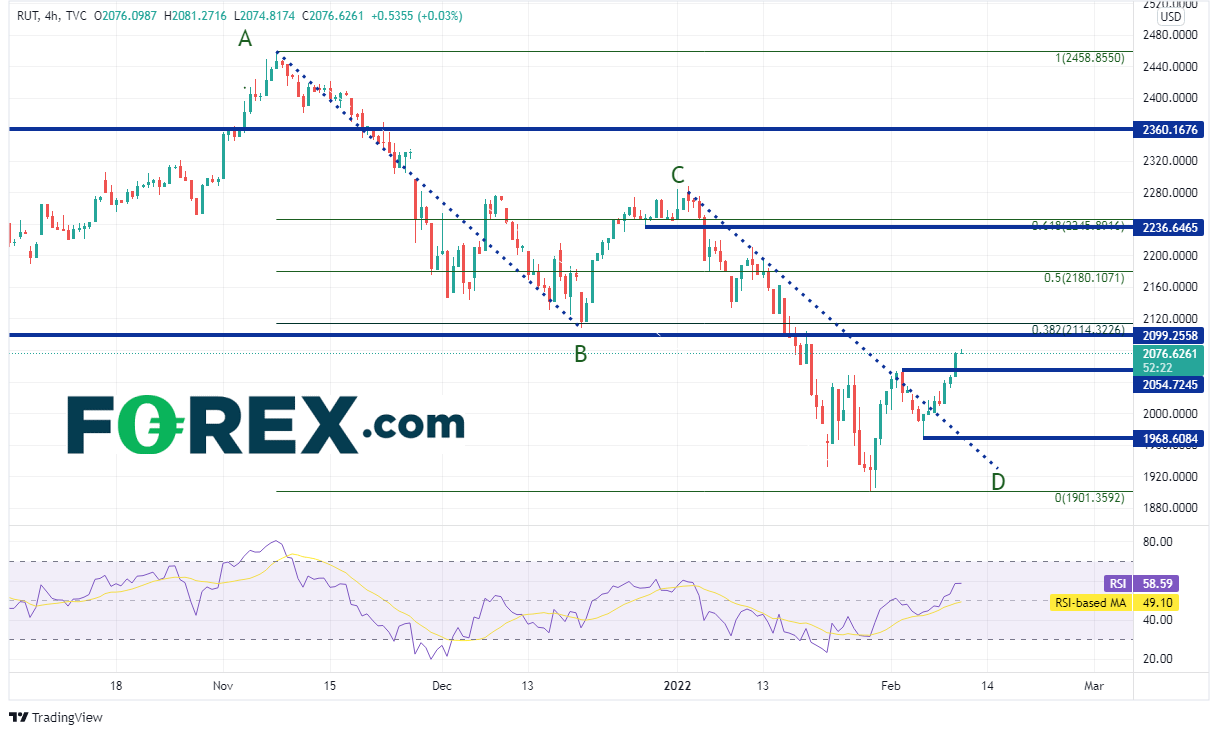
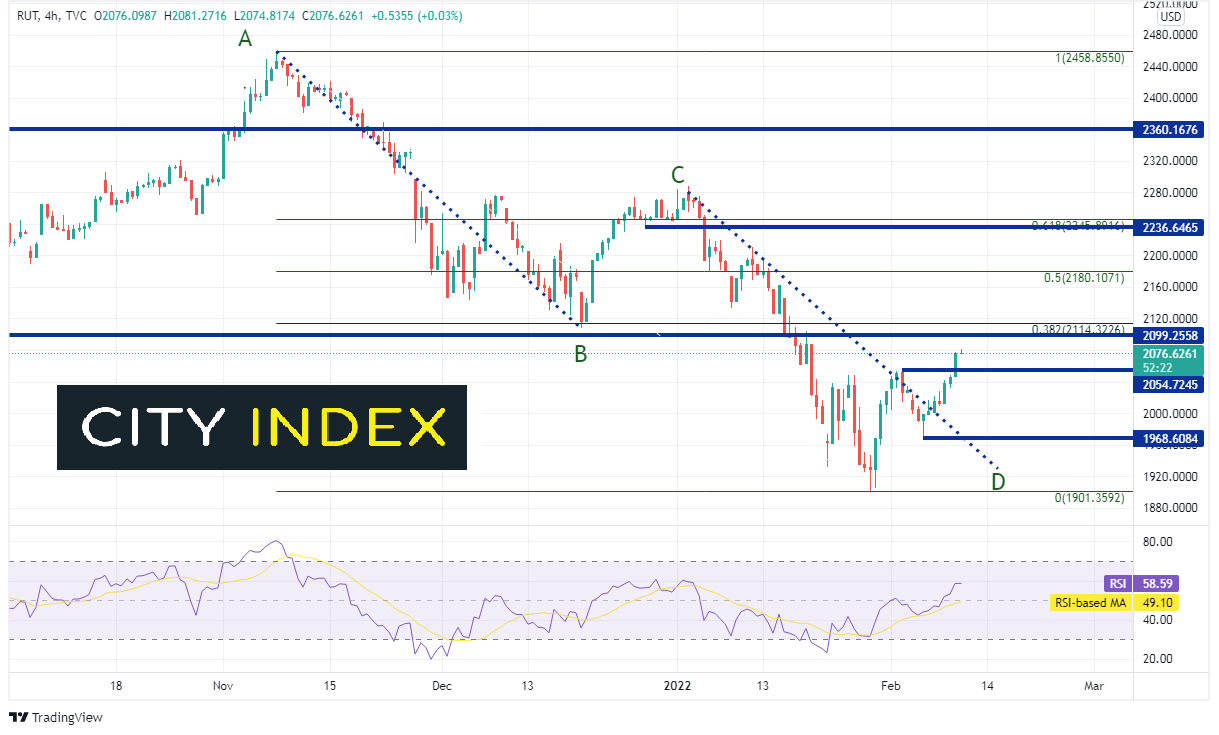
On a 240-minute timeframe, the AB=CD pattern is much clearer. Currently, the Russell 2000 is about to be tested as it closes in on a confluence of resistance at the bottom trendline of the long-term, horizontal channel and the 38.2% Fibonacci retracement level from the highs of November 2021 to the recent lows of January 28th at 2099.25 and 2114.32, respectively. Above there, resistance is at the 50% retracement level from the same timeframe at 2180.11, and then another confluence of horizontal resistance and the 61.8% Fibonacci retracement level near 2237/2246. Horizontal support is at 2054.72. Below there, price can fall to the February 4th lows at 1968.60 and then the January 28th lows at 1901.36.
Source: Tradingview, Stone X
If the Russell 2000 wants to play catch up to its peers in terms of market recovery, it will need to at least retake the 50% retracement from its all-time highs to recent lows. Thus far, it hasn’t come close. Therefore, if markets resume the recent trend lower, the Russell 2000 is likely to lead the way!
Out of the 4 major US Indices (SPX 500, Nasdaq 100, DJIA, Russell 2000), the Russell 2000 performed the worst on the since falling from all-time highs in November 2021. The small cap stock index fell into bear market territory , down over 22.5% from its all-time highs. Thus far, the Russell 2000 has regained 9.5%. See the chart below for comparison:

Source: Stone X
Trade the Russell 2000 now: Login or Open a new account!
• Open an account in the UK
• Open an account in Australia
• Open an account in Singapore
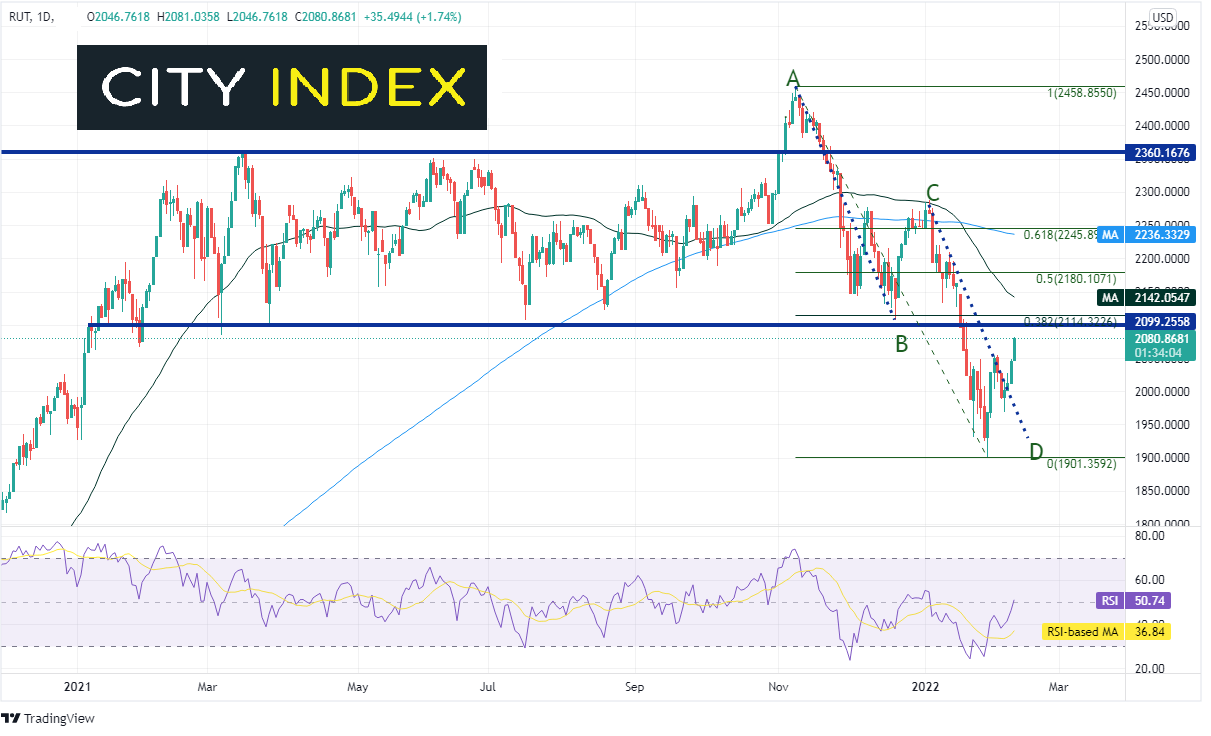
The Russell 2000 had been trading in a range between 2100 and 2360 for nearly all of 2021. In early November 2021, the small cap index broke above the channel and reached an all-time high of 2458.85 before reversing and moving back into the range. The Russell 2000 traded down to 2144.32 and bounced. This set up an AB=CD pattern (which was complete on January 27th). As is often the case, what happens on a false breakout on one side of a channel happens on the other side of the channel. Price eventually broke lower below the bottom channel line on January 19th and traded down to 1901.36, before bouncing. However, whereas the other indices have retraced AT LEAST to the 38.2% Fibonacci retracement from their all-time highs (the S&P 500 and DJIA are at their 61.8% Fibonacci retracement), the Russell 2000 has yet to come close to it yet.
Source: Tradingview, Stone X
On a 240-minute timeframe, the AB=CD pattern is much clearer. Currently, the Russell 2000 is about to be tested as it closes in on a confluence of resistance at the bottom trendline of the long-term, horizontal channel and the 38.2% Fibonacci retracement level from the highs of November 2021 to the recent lows of January 28th at 2099.25 and 2114.32, respectively. Above there, resistance is at the 50% retracement level from the same timeframe at 2180.11, and then another confluence of horizontal resistance and the 61.8% Fibonacci retracement level near 2237/2246. Horizontal support is at 2054.72. Below there, price can fall to the February 4th lows at 1968.60 and then the January 28th lows at 1901.36.
Source: Tradingview, Stone X
If the Russell 2000 wants to play catch up to its peers in terms of market recovery, it will need to at least retake the 50% retracement from its all-time highs to recent lows. Thus far, it hasn’t come close. Therefore, if markets resume the recent trend lower, the Russell 2000 is likely to lead the way!
Learn more about forex trading opportunities.
Related tags:



The complete CFD trading experience
Award-winning platforms, competitive spreads, low commissions and dedicated support.
We live and breathe the markets and are dedicated to helping traders realise their ambitions as we continue to set the industry bar.
Economic calendar
Web Trader platform
Our sophisticated web-based platform is packed with features.
Related articles

Gold Outlook: XAU/USD hit hard as US yields, dollar resume ascent
A stronger dollar, surging front-end yields and renewed geopolitical tension have combined to push gold back towards key technical support.


S&P 500, Nasdaq, Dow Forecast: Wall Street Split Widens Into Month-End 9 26 2026
Nasdaq strength contrasts with mounting Dow pressure as rising Treasury yields raise the stakes for stocks heading into the monthly close.


EUR/USD weekly outlook: Oil, inflation and NFP in focus
After coming under significant pressure in recent weeks, the EUR/USD came off its lows to finish the week on a positive note on Friday, albeit with only a mild rebound. That was not enough to prevent the exchange rate falling for the third consecutive week, as the US dollar and bond yields rallied across the board.

StoneX Europe Ltd may make third party material available on this website which may contain information included but not limited to the conditions of financial markets. The material is for information purposes only and does not contain, and should not be construed as containing, investment advice and/or investment recommendation and/or an investment research and/or an offer of or solicitation for any transactions in financial instruments; any decision to enter into a specific transaction shall be made by the client following an assessment by him/her of their situation.
StoneX Europe Ltd makes no representation or warranty and assumes no liability as to the accuracy or completeness of the information provided, nor any loss arising from any investment based on a recommendation, forecast or other information supplied. You should always seek independent advice as to your suitability to speculate in any related markets and your ability to assume the associated risks, if you are at all unsure. We are not under any obligation to update any such material. Any opinion made may be personal to the author and may not reflect the opinion of StoneX Europe Ltd.