




Shady US CPI data 10 Year Auction and ECB ahead
With the US auctions today and the ECB meeting tomorrow, price in both the DXY and EUR/USD can move in a hurry.
Share this:

The highly anticipated CPI data for February was released earlier today, and the core data was slightly worse than expected. The headline CPI print for the more closely watched YoY rate was in line at 1.7% vs 1.4% in January. However, the Fed is more concerned about the core Inflation Rate, which excludes the more volatile food and energy prices. The core inflation rate YoY down ticked from 1.4% in January to 1.3% in February, vs a 1.4% expectation. Curious as to how the core rate could be lower with higher energy prices and higher food prices? The BLS said that “data collection in February was affected by temporary closing of limited operation of certain types of establishments”. In other words, the data is kind of spotty and shouldn’t be relied on.
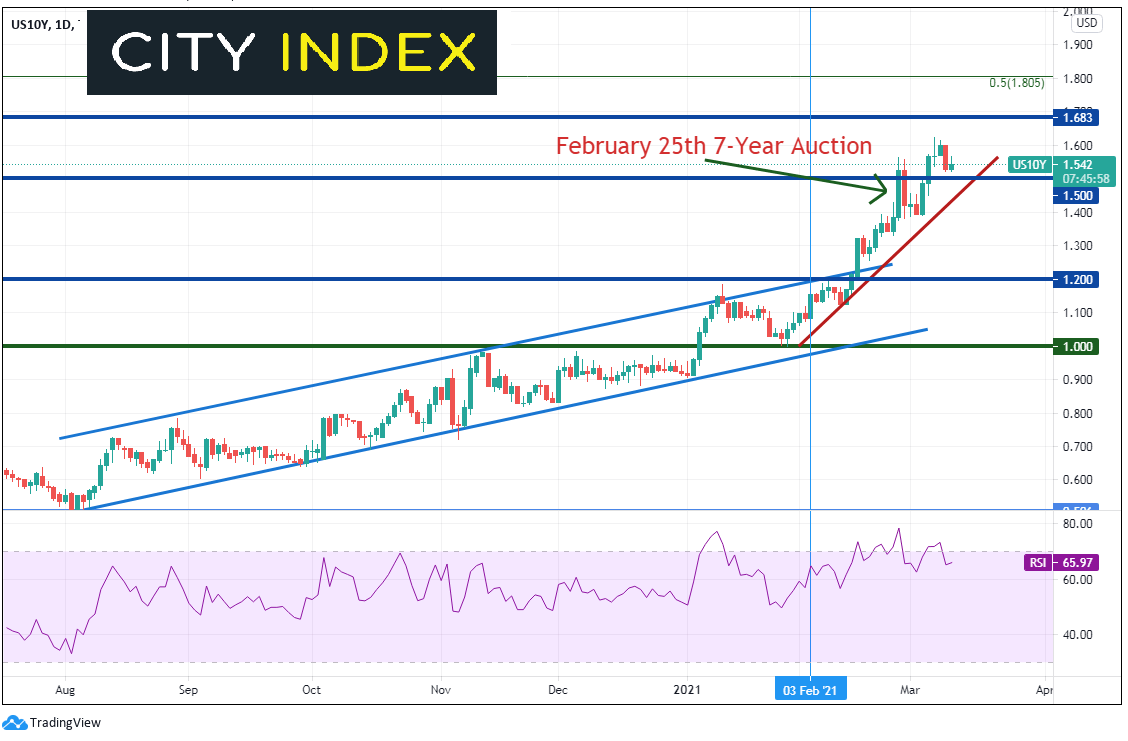
Today, the US Treasury will auction off $58 billion of 10-year notes. Results will be made available shortly after 1:00pm ET. Yesterday’s 3-year note auction was strong. However, the longer-term duration auctions will be more closely monitored. (Tomorrow is a 30-year auction.). Recall on February 25th the 7-year auction that was extremely weak. This sent yields higher, primarily in the belly of the curve. 10-year yields shot up to 1.6%, and worried stock investors. Yields, bid-to cover ratio, and the number of indirect buyers should be monitored to determine whether the auction was successful. After the weak 7-year auction, bonds and stocks continued lower while yields and the US Dollar moved higher.
Source: Tradingview, City Index
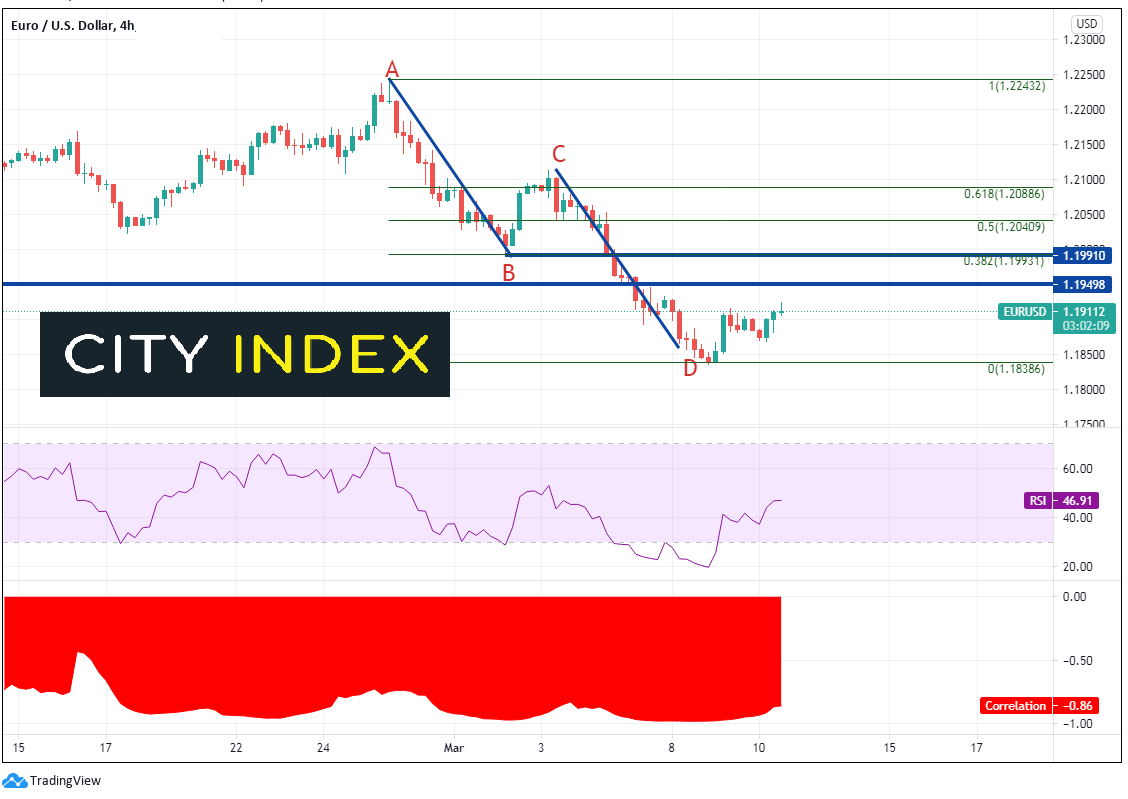
After the weaker Core CPI data, which implies the Fed will keep its unprecedented QE for longer (as Fed members have been saying), the US Dollar Index (DXY) sold off and stocks went bid. This can be seen in the price action of EUR/USD, which is highly inversely correlated with the US Dollar Index. (EUR/USD was also our Currency Pair of the Week). The current correlation coefficient is -0.87 on a 240-minute timeframe. For reference, a reading of -1.00 means that the 2 assets are perfectly negatively correlated. After completing an AB=CD price pattern, EUR/USD moved higher and is approaching horizontal resistance near 1.1950, which dates to the lows of February 5th. Above there is the 38.2% Fibonacci retracement from the February 25th highs to the March 8th lows near 1.1990, which also confluences with horizontal resistance. Support is at the March 8th lows near 1.1835.
Source: Tradingview, City Index
Remember that the ECB meeting is tomorrow. See our ECB Preview here. With the US auctions today and the ECB meeting tomorrow, price in both the DXY and EUR/USD can move in a hurry.
Learn more about forex trading opportunities.
The highly anticipated CPI data for February was released earlier today, and the core data was slightly worse than expected. The headline CPI print for the more closely watched YoY rate was in line at 1.7% vs 1.4% in January. However, the Fed is more concerned about the core Inflation Rate, which excludes the more volatile food and energy prices. The core inflation rate YoY down ticked from 1.4% in January to 1.3% in February, vs a 1.4% expectation. Curious as to how the core rate could be lower with higher energy prices and higher food prices? The BLS said that “data collection in February was affected by temporary closing of limited operation of certain types of establishments”. In other words, the data is kind of spotty and shouldn’t be relied on.
Today, the US Treasury will auction off $58 billion of 10-year notes. Results will be made available shortly after 1:00pm ET. Yesterday’s 3-year note auction was strong. However, the longer-term duration auctions will be more closely monitored. (Tomorrow is a 30-year auction.). Recall on February 25th the 7-year auction that was extremely weak. This sent yields higher, primarily in the belly of the curve. 10-year yields shot up to 1.6%, and worried stock investors. Yields, bid-to cover ratio, and the number of indirect buyers should be monitored to determine whether the auction was successful. After the weak 7-year auction, bonds and stocks continued lower while yields and the US Dollar moved higher.
Source: Tradingview, FOREX.com
After the weaker Core CPI data, which implies the Fed will keep its unprecedented QE for longer (as Fed members have been saying), the US Dollar Index (DXY) sold off and stocks went bid. This can be seen in the price action of EUR/USD, which is highly inversely correlated with the US Dollar Index. (EUR/USD was also our Currency Pair of the Week). The current correlation coefficient is -0.87 on a 240-minute timeframe. For reference, a reading of -1.00 means that the 2 assets are perfectly negatively correlated. After completing an AB=CD price pattern, EUR/USD moved higher and is approaching horizontal resistance near 1.1950, which dates to the lows of February 5th. Above there is the 38.2% Fibonacci retracement from the February 25th highs to the March 8th lows near 1.1990, which also confluences with horizontal resistance. Support is at the March 8th lows near 1.1835.
Source: Tradingview, FOREX.com
Remember that the ECB meeting is tomorrow. See our ECB Preview here. With the US auctions today and the ECB meeting tomorrow, price in both the DXY and EUR/USD can move in a hurry.
Learn more about forex trading opportunities.



The complete CFD trading experience
Award-winning platforms, competitive spreads, low commissions and dedicated support.
We live and breathe the markets and are dedicated to helping traders realise their ambitions as we continue to set the industry bar.
Economic calendar
Web Trader platform
Our sophisticated web-based platform is packed with features.
Related articles

Gold Outlook: XAU/USD hit hard as US yields, dollar resume ascent
A stronger dollar, surging front-end yields and renewed geopolitical tension have combined to push gold back towards key technical support.


EUR/USD weekly outlook: Oil, inflation and NFP in focus
After coming under significant pressure in recent weeks, the EUR/USD came off its lows to finish the week on a positive note on Friday, albeit with only a mild rebound. That was not enough to prevent the exchange rate falling for the third consecutive week, as the US dollar and bond yields rallied across the board.


USD/JPY Weekly Outlook: Payrolls loom as US rates remain the dominant driver
Strong US growth and hawkish Fed pricing continue to support USD/JPY, while intervention risk appears to be kicking in at lower levels
StoneX Europe Ltd may make third party material available on this website which may contain information included but not limited to the conditions of financial markets. The material is for information purposes only and does not contain, and should not be construed as containing, investment advice and/or investment recommendation and/or an investment research and/or an offer of or solicitation for any transactions in financial instruments; any decision to enter into a specific transaction shall be made by the client following an assessment by him/her of their situation.
StoneX Europe Ltd makes no representation or warranty and assumes no liability as to the accuracy or completeness of the information provided, nor any loss arising from any investment based on a recommendation, forecast or other information supplied. You should always seek independent advice as to your suitability to speculate in any related markets and your ability to assume the associated risks, if you are at all unsure. We are not under any obligation to update any such material. Any opinion made may be personal to the author and may not reflect the opinion of StoneX Europe Ltd.