




S&P technical analysis: Bears back in town or temporary respite?
The Nasdaq and S&P 500 both seem somewhat overbought following a rapid three-week surge. Wednesday's price action has raised the possibility of a short-term pullback. Despite this, it's essential to differentiate any potential short-term weakness from a bearish reversal, unless price action on the charts or a strong pushback from the Federal Reserve indicate otherwise.
Share this:

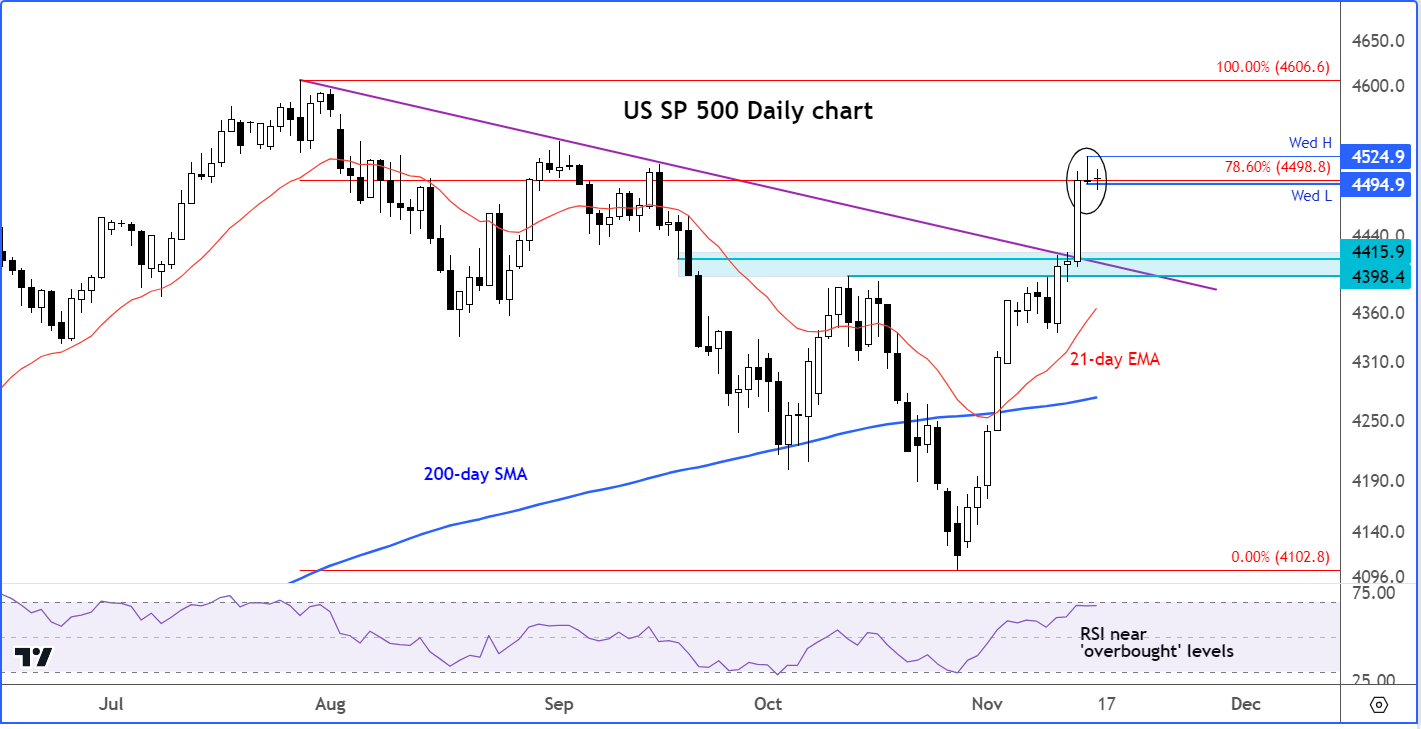
- S&P 500 technical analysis: Doji candle at 78.6% Fibonacci retracement level calls for caution
- Nasdaq technical analysis: Inverted hammer off summer highs point to possible bearish reversal… or a trap
- US Stocks have surged higher in recent weeks on hopes of peak interest rates
Technical analysis: Nasdaq, S&P and DAX - Video
In recent weeks, the US stock markets have been experiencing one of their most favourable periods this year. This positive trend can be attributed to the prevailing optimism that interest rates will soon fall, given the downward trajectory of inflation. However, it's worth noting that the markets, particularly the tech-heavy Nasdaq and S&P 500 both seem somewhat overbought following a rapid three-week surge. This raises the possibility of a short-term pullback. Despite this, it's essential to differentiate any potential short-term weakness from a bearish reversal, unless price action on the charts or a strong pushback from the Federal Reserve indicate otherwise.
S&P 500 technical analysis
Yesterday saw the likes of the S&P and Nasdaq extend their impressive three-week rally, with the latter rising to test the July high, marking its highest point since January 2022. These gains were spurred by fresh US data revealing further signs of easing inflationary pressures, notably a surprising decline in prices paid to US producers in October, the most significant drop since April 2020. However, upon the opening of the cash markets, the Nasdaq, S&P and Russell all retreated from their earlier highs and closed near or below their opening levels.
The resulting price action left behind a small doji candle. It is all about follow-through now. Does it go below Wednesday’s low and hold there, or do we continue pressing higher? The bears would want to see some downside follow-through to before stepping back in, while the bulls will probably prefer a bit of bullish consolidation rather than a sharp sell-off, in order to help work off overbought conditions through time than price action.
In the event the index breaks Wednesday’s low at 4495 decisively, then this could pave the way for a potential drop to 4415 area, the base of this week’s breakout.
Nasdaq 100 technical analysis
From a technical point of view, the sharp 3-week rally means the Nasdaq is now at ‘overbought’ levels, as indicated by the momentum indicator RSI, in the sub-chart, moving above the 70 threshold.
Interestingly, the RSI ‘overbought’ threshold has been reached with the underlying Nasdaq index testing its summer high of around 15933 yesterday when it couldn’t hold onto its earlier gains. The potential for the index to form a double top or a false break reversal pattern is therefore there. We just need to see some downside follow-through below Wednesday’s low now to trigger some momentum selling pressure. Even if we don’t see a major bearish reversal here, a small correction cannot be ruled out at this stage.
The underlying trend is bullish, so we would expect dips back to major support levels to hold. In the event of a breakdown, the key support level that will then become into focus would at 15533, the high from Monday.
For now, there are only modest signs of potential trouble for the bulls. But with everything mentioned, the bulls may wish to proceed with extra care from here, after enjoying a sharp three-week rally. The bears meanwhile will need to await further price action and a clear indication of a short-term top before pouncing again. A clean break below Wednesday’s low could be the trigger.
Source for all charts used in this article: TradingView.com
-- Written by Fawad Razaqzada, Market Analyst
Follow Fawad on Twitter @Trader_F_R
How to trade with City Index
You can trade with City Index by following these four easy steps:
- Open an account, or log in if you’re already a customer
• Open an account in the UK
• Open an account in Australia
• Open an account in Singapore
- Search for the company you want to trade in our award-winning platform
- Choose your position and size, and your stop and limit levels
- Place the trade
Related tags:
Latest market news




The complete CFD trading experience
Award-winning platforms, competitive spreads, low commissions and dedicated support.
We live and breathe the markets and are dedicated to helping traders realise their ambitions as we continue to set the industry bar.
Economic calendar
Web Trader platform
Our sophisticated web-based platform is packed with features.
Related articles
RBA delivers 25bp hike, Bullock now the main event
The RBA delivered the expected 25bp hike, but Bullock’s press conference now looms as the bigger volatility risk for AUD/USD and the ASX 200.
Gold outlook: XAU/USD hammered, stretched and vulnerable to a sharp rebound
Gold is getting hammered for solid fundamental reasons, but history suggests extreme four-hourly oversold conditions can produce violent countertrend rallies.
Gold forecast: Rising yields become too hot for gold, but the outlook is far from bearish
Gold and silver prices took a plunge today, with the former down 3% and the latter falling some 5% by mid European session, before bouncing off their lows. The losses come after the metals remained largely supported until last week, despite the big dollar rally and surging bond yields as we have seen in recent weeks. But it simply got too much, and the metals succumbed to pressure today.
StoneX Europe Ltd may make third party material available on this website which may contain information included but not limited to the conditions of financial markets. The material is for information purposes only and does not contain, and should not be construed as containing, investment advice and/or investment recommendation and/or an investment research and/or an offer of or solicitation for any transactions in financial instruments; any decision to enter into a specific transaction shall be made by the client following an assessment by him/her of their situation.
StoneX Europe Ltd makes no representation or warranty and assumes no liability as to the accuracy or completeness of the information provided, nor any loss arising from any investment based on a recommendation, forecast or other information supplied. You should always seek independent advice as to your suitability to speculate in any related markets and your ability to assume the associated risks, if you are at all unsure. We are not under any obligation to update any such material. Any opinion made may be personal to the author and may not reflect the opinion of StoneX Europe Ltd.