








SP500 The Long Short Of It SPX SYS ORLY EBAY TXN
The S&P500 closed to record highs, yet with resistance nearby its touch and go as to whether it can hold above key support.
Share this:

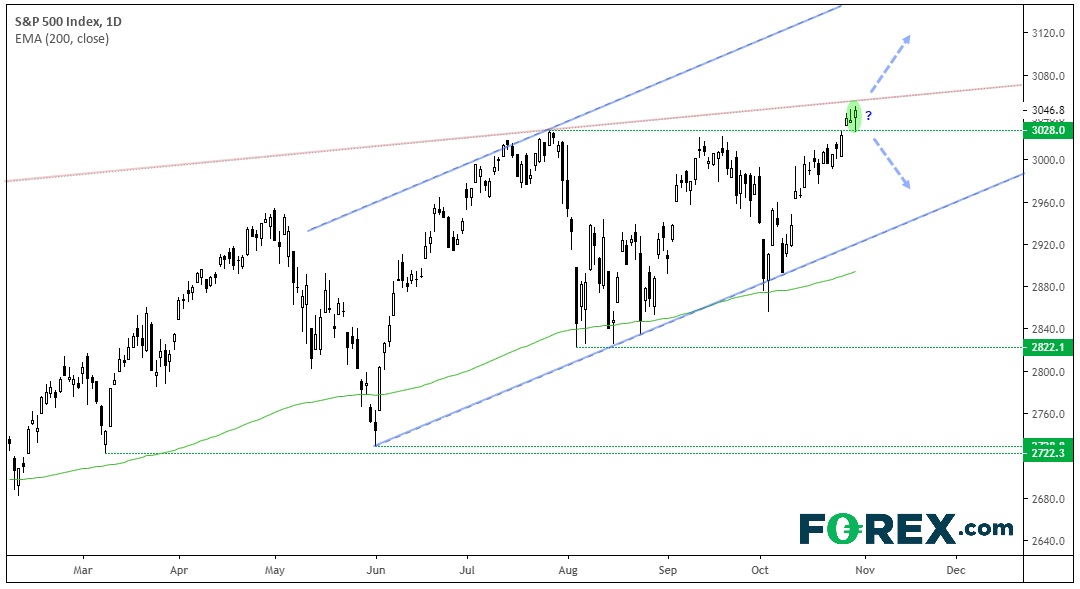
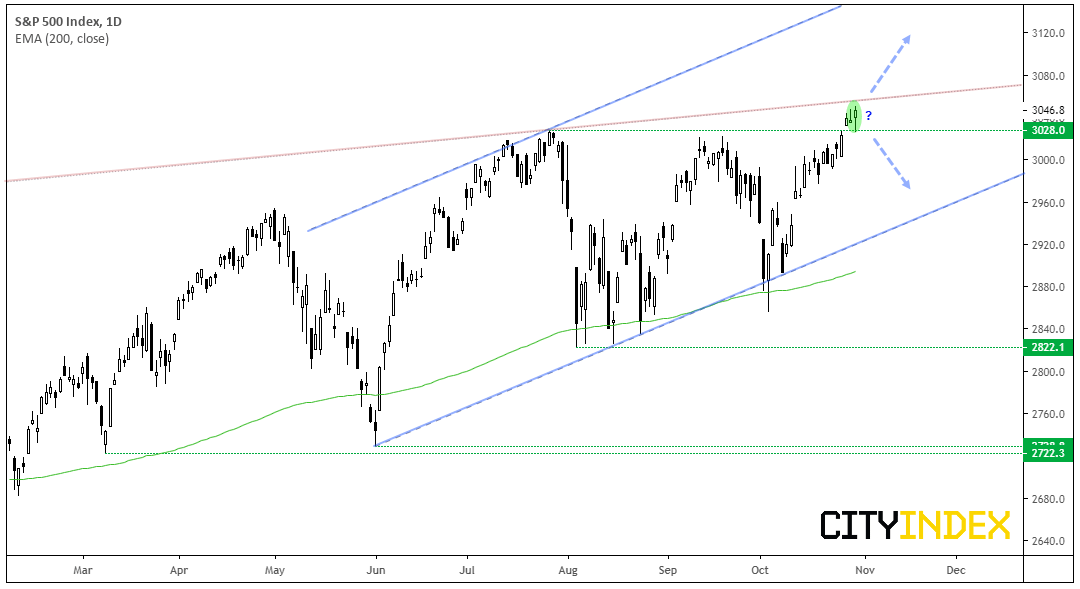
The S&P500 closed to new highs following yesterday’s Fed meeting, supported by higher earnings whilst also taking comfort from Powell’s comments that a hike is unlikely. Technically, it rests on the pivotal level of 3028, yet resistance nearby awaits. A break above the Jan 2018 resistance level assume bullish trend continuation, whereas a break back beneath 3028 warns of a bull-trap and deeper correction.
Flicking through equities for the S&P500 showed greater potential for short setups than longs. Perhaps that’s a bad omen for new highs on S&P500, although part of the reason many longs were rejected were because they were either too close to earnings or overextended without any signs of a pullback.
Sysco Corp CFD/DFT: Trading just off its all-time highs, prices have had a chance to consolidate below 80 which has provided adequate mean reversion for a potential long setup. The recent higher low has respected the 20-day average and it appears that prices could just as easily break higher as it could produce another higher low to form a potential ascending triangle.
Keep I mind that earnings are on the 4th November, where a notable earnings miss could topple this from its highs. Hopefully though, they’ll be supportive of this compelling setup.
O'Reilly Automotive Inc CFD/DFT: Positive earnings saw this explode higher out of an ascending triangle and found resistance around the monthly R3 pivot (not pictured for a cleaner chart). A hammer at the highs showed prices were exhausted and now a retracement is underway. This may be a little premature for the watchlist, but it’s worthy keeping an eye on none the less given the strength of the breakout.
With little in the way of support above 410-415, traders can see if prices stabilise around a Fibonacci level. If satisfied a higher low has formed, a volatility such as ATR can be used to calculate the ‘invalidation point’ of the bullish bias. Bullish swing traders could then look to enter, or for a more conservative approach, wait for signs bullish momentum has returned to provide greater confidence the low is in.
Ebay CFD/DFT: Long known for its discounts, Ebay’s stock price also found itself on sale following poor earnings last week. Thursday’s large gap lower saw it plummet through the 200-day eMA and now prices are clinging onto key support around $35. The fact it has failed to provide any meaningful rally despite the S&P500 hitting new highs is telling, as is the declining volume during this week’s lacklustre ‘rebound’.
- Bias is for a break to new lows and for prices to target the upside gap around 32.33.
- Bears can either wait for a break below 35.00/35.19, or fade into rallies below 37.23.
- If the trend takes off then bears could look to ‘close’ the gap around 31 and take it south.
- A break above 37.23 places it onto the backburner, although it still leaves potential for a large rounding top pattern to develop over the coming weeks if it remains below 39.35
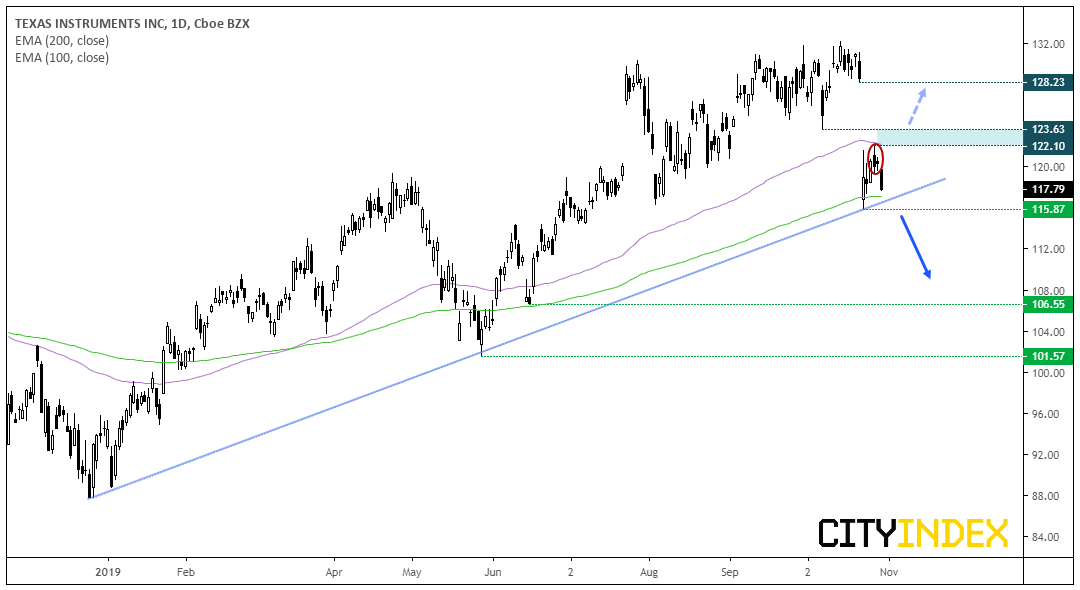
Texas Instruments CFD/DFT: The gap lower last week took prices straight down to the bullish trendline and 200-day eMA. So, we’re at another juncture where bulls either save the day and keep prices above these levels, or the dead cat has bounced and we’re waiting for a break lower.
Given the magnitude of the gap from its highs (a breakaway gap) and that the pullback from the trendline has found resistance below the 100-day average, the bias is for a break lower.
- Bias remains bearish below 122.10
- Bears can wait for a break below the 200-eMA and bullish trendline. A more cautious approach is to wait for a break beneath 115.87.
- A break above 122.10 also breaks the 100-day eMA. Bulls could look to close the gap towards 128.23, although 126.63 could provide interim resistance.
The S&P500 closed to new highs following yesterday’s Fed meeting, supported by higher earnings whilst also taking comfort from Powell’s comments that a hike is unlikely. Technically, it rests on the pivotal level of 3028, yet resistance nearby awaits. A break above the Jan 2018 resistance level assume bullish trend continuation, whereas a break back beneath 3028 warns of a bull-trap and deeper correction.
Flicking through equities for the S&P500 showed greater potential for short setups than longs. Perhaps that’s a bad omen for new highs on S&P500, although part of the reason many longs were rejected were because they were either too close to earnings or overextended without any signs of a pullback.
Sysco Corp CFD/DFT: Trading just off its all-time highs, prices have had a chance to consolidate below 80 which has provided adequate mean reversion for a potential long setup. The recent higher low has respected the 20-day average and it appears that prices could just as easily break higher as it could produce another higher low to form a potential ascending triangle.
Keep I mind that earnings are on the 4th November, where a notable earnings mis could topple this from its highs. Hopefully though, they’ll be supportive of this compelling setup.
O'Reilly Automotive Inc CFD/DFT: Positive earnings saw this explode higher out of an ascending triangle and found resistance around the monthly R3 pivot (not pictured for a cleaner chart). A hammer at the highs showed prices were exhausted and now a retracement is underway. This may be a little premature for the watchlist, but it’s worthy keeping an eye on none the less given the strength of the breakout.
With little in the way of support above 410-415, traders can see if prices stabilise around a Fibonacci level. If satisfied a higher low has formed, a volatility such as ATR can be used to calculate the ‘invalidation point’ of the bullish bias. Bullish swing traders could then look to enter, or for a more conservative approach, wait for signs bullish momentum has returned to provide greater confidence the low is in.
Ebay CFD/DFT: Long known for its discounts, Ebay’s stock price also found itself on sale following poor earnings last week. Thursday’s large gap lower saw it plummet through the 200-day eMA and now prices are clinging onto key support around $35. The fact it has failed to provide any meaningful rally despite the S&P500 hitting new highs is telling, as is the declining volume during this week’s lacklustre ‘rebound’.
- Bias is for a break to new lows and for prices to target the upside gap around 32.33.
- Bears can either wait for a break below 35.00/35.19, or fade into rallies below 37.23.
- If the trend takes off then bears could look to ‘close’ the gap around 31 and take it south.
- A break above 37.23 places it onto the backburner, although it still leaves potential for a large rounding top pattern to develop over the coming weeks if it remains below 39.35
Texas Instruments CFD/DFT: The gap lower last week took prices straight down to the bullish trendline and 200-day eMA. So, we’re at another juncture where bulls either save the day and keep prices above these levels, or the dead cat has bounced and we’re waiting for a break lower.
Given the magnitude of the gap from its highs (a breakaway gap) and that the pullback from the trendline has found resistance below the 100-day average, the bias is for a break lower.
- Bias remains bearish below 122.10
- Bears can wait for a break below the 200-eMA and bullish trendline. A more cautious approach is to wait for a break beneath 115.87.
- A break above 122.10 also breaks the 100-day eMA. Bulls could look to close the gap towards 128.23, although 126.63 could provide interim resistance.
Related analysis:
FTSE: The Long And Short Of It | FTSE, AVST, BA, GRG
S&P500: Long and Short of It | S&P, Starbucks, Assurance
Related tags:
Latest market news




The complete CFD trading experience
Award-winning platforms, competitive spreads, low commissions and dedicated support.
We live and breathe the markets and are dedicated to helping traders realise their ambitions as we continue to set the industry bar.
Economic calendar
Web Trader platform
Our sophisticated web-based platform is packed with features.
Related articles

Nikkei threatens breakout as tech rebound broadens
Breakouts across the SOX and Nasdaq are being matched by rebounds across Asia, with the Nikkei now threatening to join the move.

Nasdaq 100 Forecast: Confidence Returns as the Index Challenges Record Highs
The trading week is getting underway with renewed bullish momentum across Nasdaq. This is reflected in today's session, where the index has gained more than 2.5%, highlighting a buying bias that has not been observed with this level of strength in several weeks.


Nasdaq breakout builds as crude falls and chip stocks surge
Lower oil prices, semiconductor strength and improving technical momentum are helping Nasdaq futures overcome a hostile backdrop of higher Treasury yields and a stronger US dollar.
StoneX Europe Ltd may make third party material available on this website which may contain information included but not limited to the conditions of financial markets. The material is for information purposes only and does not contain, and should not be construed as containing, investment advice and/or investment recommendation and/or an investment research and/or an offer of or solicitation for any transactions in financial instruments; any decision to enter into a specific transaction shall be made by the client following an assessment by him/her of their situation.
StoneX Europe Ltd makes no representation or warranty and assumes no liability as to the accuracy or completeness of the information provided, nor any loss arising from any investment based on a recommendation, forecast or other information supplied. You should always seek independent advice as to your suitability to speculate in any related markets and your ability to assume the associated risks, if you are at all unsure. We are not under any obligation to update any such material. Any opinion made may be personal to the author and may not reflect the opinion of StoneX Europe Ltd.