



Tariff Threats Cap USDCAD Gains Below 1.39
USDCAD gains are being capped in line with broader risk assets amid escalating tariff threats between the U.S. and the EU over Greenland. Last year, tariff rhetoric weighed heavily on dollar pairs — what are this year’s scenarios?
Share this:

Key Events
- Rising Volatility Risk: Market volatility is expected to build into Wednesday amid ongoing tariff rhetoric and an anticipated Trump speech at the World Economic Forum.
- Canadian CPI Softens: Canadian CPI readings fell below expectations, to levels last seen in January 2025, reinforcing near-term USD strength versus CAD, despite ongoing tariff-related uncertainty.
- Pressure on Dollar Pairs: Dollar pairs face near-term drawdown risks as geopolitical uncertainty revives concerns reminiscent of early-2025 volatility.
- Haven Demand: Demand across gold and silver is expected to remain supported as geopolitical headlines continue to shape risk sentiment into 2026.
USDCAD gains remain capped alongside risk assets amid tariff escalation risks between the U.S. and the EU over Greenland, despite the latest downside surprise in Canadian inflation data. CPI m/m and trimmed CPI fell to 0.2% and 2.7%, respectively — levels last seen in January 2025.
Last year, tariff threats pressured dollar pairs, pushing the DXY down toward a 17-year support near 96, while major pairs including USDCAD reached historical levels near 1.4790. A similarly fragile backdrop is emerging, with USDCAD rejecting the 1.39 resistance twice, as the dollar struggles to hold above the 100 mark and both the Fed and BoC are expected to remain on hold.
Key Levels and Scenarios in Focus
USDCAD Daily Time Frame – Log Scale
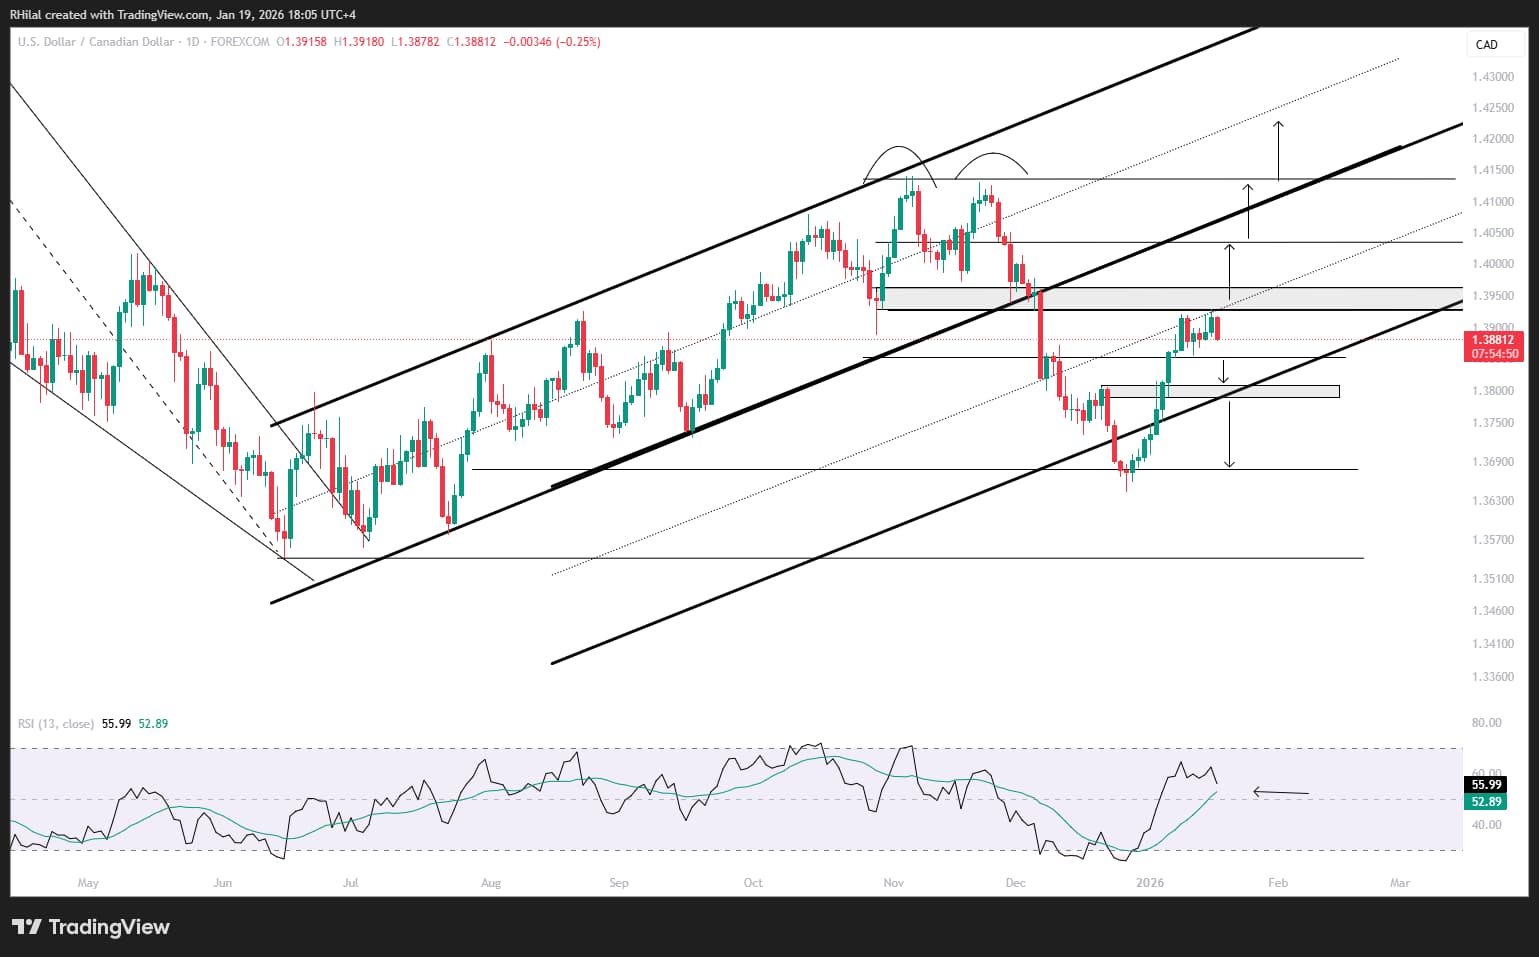
Source: Trading view
In line with the major double-top formation traced on the USDCAD chart in November 2025, a smaller double-top potential is developing below the neckline of the initial pattern at 1.39.
A clean hold above 1.39 would be expected to extend gains toward 1.4040 and 1.4140, aligning with Fibonacci extension levels derived from the June 2025 low, November 2025 high, and December 2025 low.
As long as these levels are respected and Fibonacci extensions continue to align with price action, the near-term bias remains constructive. However, short-term drawdowns may unfold should the smaller double-top pattern materialize, with key support levels at 1.3850, followed by 1.3790 and 1.3680, before shifting the bias back to the downside.
Downside headwinds across major dollar pairs may also emerge — notably USDJPY, given stretched momentum conditions and resurfacing tariff risks — keeping key technical levels in focus to confirm any shift in the broader bullish dollar narrative.
Written by Razan Hilal, CMT
Follow on Rh_waves
Latest market news




The complete CFD trading experience
Award-winning platforms, competitive spreads, low commissions and dedicated support.
We live and breathe the markets and are dedicated to helping traders realise their ambitions as we continue to set the industry bar.
Economic calendar
Web Trader platform
Our sophisticated web-based platform is packed with features.
Related articles
US Dollar Short-term Outlook: USD Rally on the Line as Midterms, NFP Loom 11 3 2026
DXY is testing pivotal support, with the weekly range breakout likely to determine the next major leg of the trend as key event risk unfolds.

USD/JPY Analysis: Rising U.S. Yields Leave the Yen on the Defensive
As the first week of November progresses, renewed weakness in the Japanese yen is once again becoming evident in the short term. This dynamic can be seen in the recent performance of USD/JPY, which has posted two consecutive bullish sessions and gained more than 0.7%, reflecting a return of buying interest in the dollar while the yen continues to lose momentum.
Australian Dollar Technical Outlook: AUD/USD October Breakout Reverses Toward Critical Support 11 3 2026
Aussie bulls face a critical test of rising trend support, with the October recovery under threat as selling pressure builds into November.
StoneX Europe Ltd may make third party material available on this website which may contain information included but not limited to the conditions of financial markets. The material is for information purposes only and does not contain, and should not be construed as containing, investment advice and/or investment recommendation and/or an investment research and/or an offer of or solicitation for any transactions in financial instruments; any decision to enter into a specific transaction shall be made by the client following an assessment by him/her of their situation.
StoneX Europe Ltd makes no representation or warranty and assumes no liability as to the accuracy or completeness of the information provided, nor any loss arising from any investment based on a recommendation, forecast or other information supplied. You should always seek independent advice as to your suitability to speculate in any related markets and your ability to assume the associated risks, if you are at all unsure. We are not under any obligation to update any such material. Any opinion made may be personal to the author and may not reflect the opinion of StoneX Europe Ltd.