





Tariffs Tariffs and More Tariffs
US President Trump decided enough is enough already.
Share this:

Yesterday, US President Trump decided enough is enough already. First, he restored tariffs on Argentina and Brazil for aluminum and steel imports to the United States. He cited a “massive devaluation of their currencies”, which in turn hurts American farmers. Later in the day, it was determined after a five-month investigation that a French digital tax discriminated against American Internet companies. As a result, tariffs of up to $2.4 billion on French consumer imports to the United States was proposed. In addition, ISM Manufacturing Data was worse than expected in the United States. Combine these factors together, and most major stock indices were down near 1% yesterday. In addition, the US Dollar Index was also down 0.5%.
Today, President Trump said, “I have no deadline on China deal and it might be better to wait until after November 2020 election”. And later, Commerce Secretary Wilbur Ross said, “December 15th tariffs on Chinese imports will be applied unless there is some real reason to postpone them, such as substantive progress in talks”. Stocks continued to sell off today, with major indices currently down nearly another 1%.
Source: Tradingview, City Index
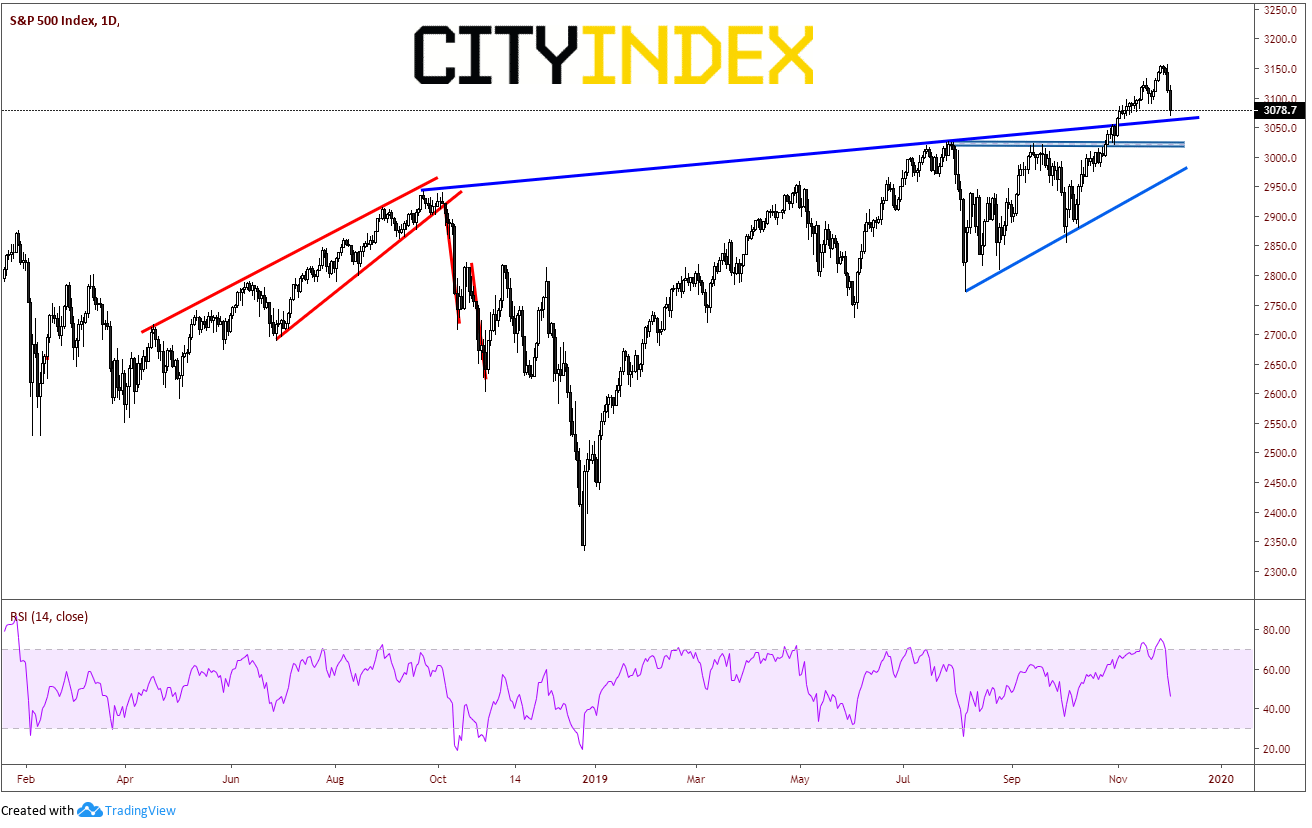
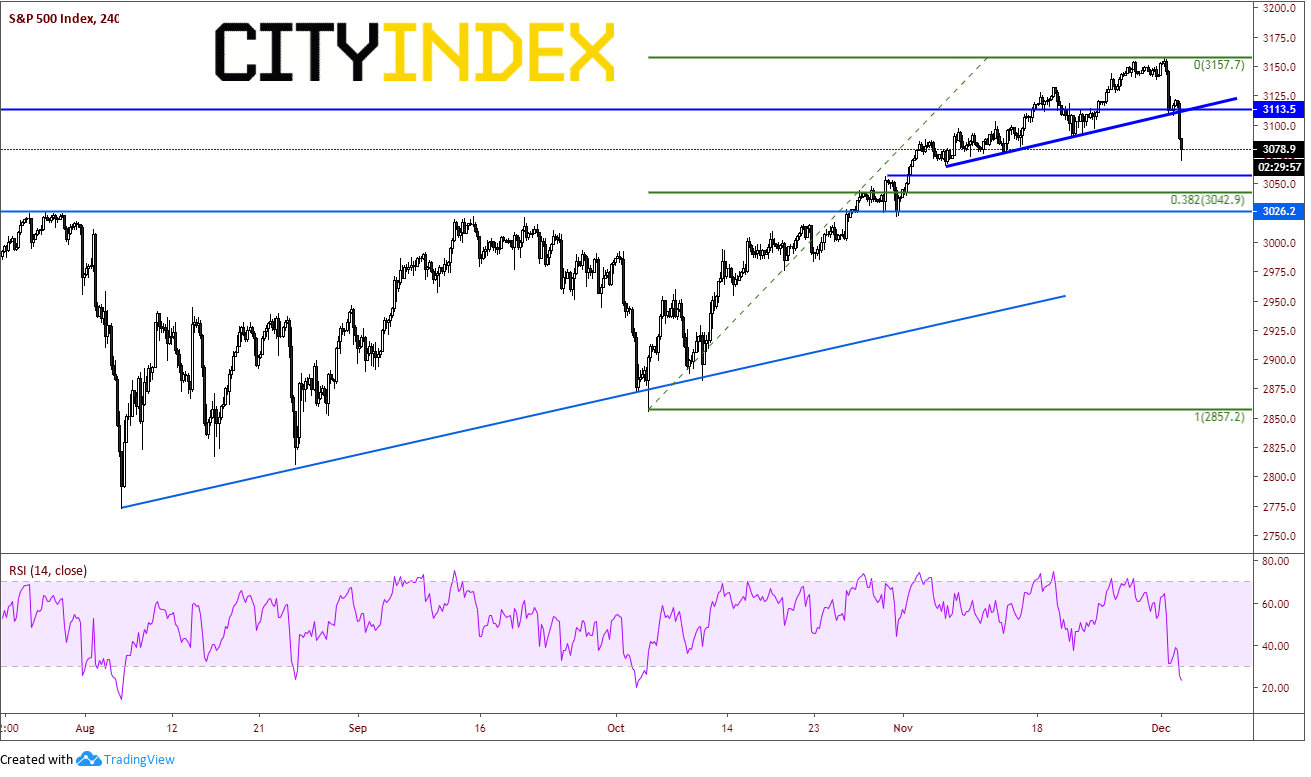
Although the S&P 500 is down nearly 80 handles in two days, price still has room to run down towards 3065, which is the upward sloping trendline dating back to September 2018. There is also horizontal support just below that level near 3060. Psychological resistance now comes across back at 3100, and then horizontal and trendline resistance on the 240-minute timeframe near 3113.
Source: Tradingview, City Index
However, there is one big difference between yesterday and today in terms of market action. Yesterday the DXY participated and sold off. The bond market was relatively muted. Today, the bond market is rallying and the DXY is close to unchanged. Bond prices and yields are inversely related, so as bond prices go bid, yields move lower. US 10 Year Yields are down nearly -5.7% at 1.72. This is the third time yields have tested this level, as it is the 50% retracement level from the lows on October 8th to the highs on November 7th. If bonds continue to rally, yields will continue to fall. The next level of support for yields is the 61.8% Fibonacci retracement level of the previously mentioned timeframe at 1.684.
Source: Tradingview, City Index
As the markets are currently in risk off mode, watch for comments and headlines to try and soften the blow of the tariffs and the possible US-China trade deal delay. With the markets down about 2% in two days, support levels may hold as the market takes a breather ahead of ADP payrolls tomorrow and NFP on Friday.
Yesterday, US President Trump decided enough is enough already. First, he restored tariffs on Argentina and Brazil for aluminum and steel imports to the United States. He cited a “massive devaluation of their currencies”, which in turn hurts American farmers. Later in the day, it was determined after a five-month investigation that a French digital tax discriminated against American Internet companies. As a result, tariffs of up to $2.4 billion on French consumer imports to the United States was proposed. In addition, ISM Manufacturing Data was worse than expected in the United States. Combine these factors together, and most major stock indices were down near 1% yesterday. In addition, the US Dollar Index was also down 0.5%.
Today, President Trump said, “I have no deadline on China deal and it might be better to wait until after November 2020 election”. And later, Commerce Secretary Wilbur Ross said, “December 15th tariffs on Chinese imports will be applied unless there is some real reason to postpone them, such as substantive progress in talks”. Stocks continued to sell off today, with major indices currently down nearly another 1%.
Source: Tradingview, FOREX.com
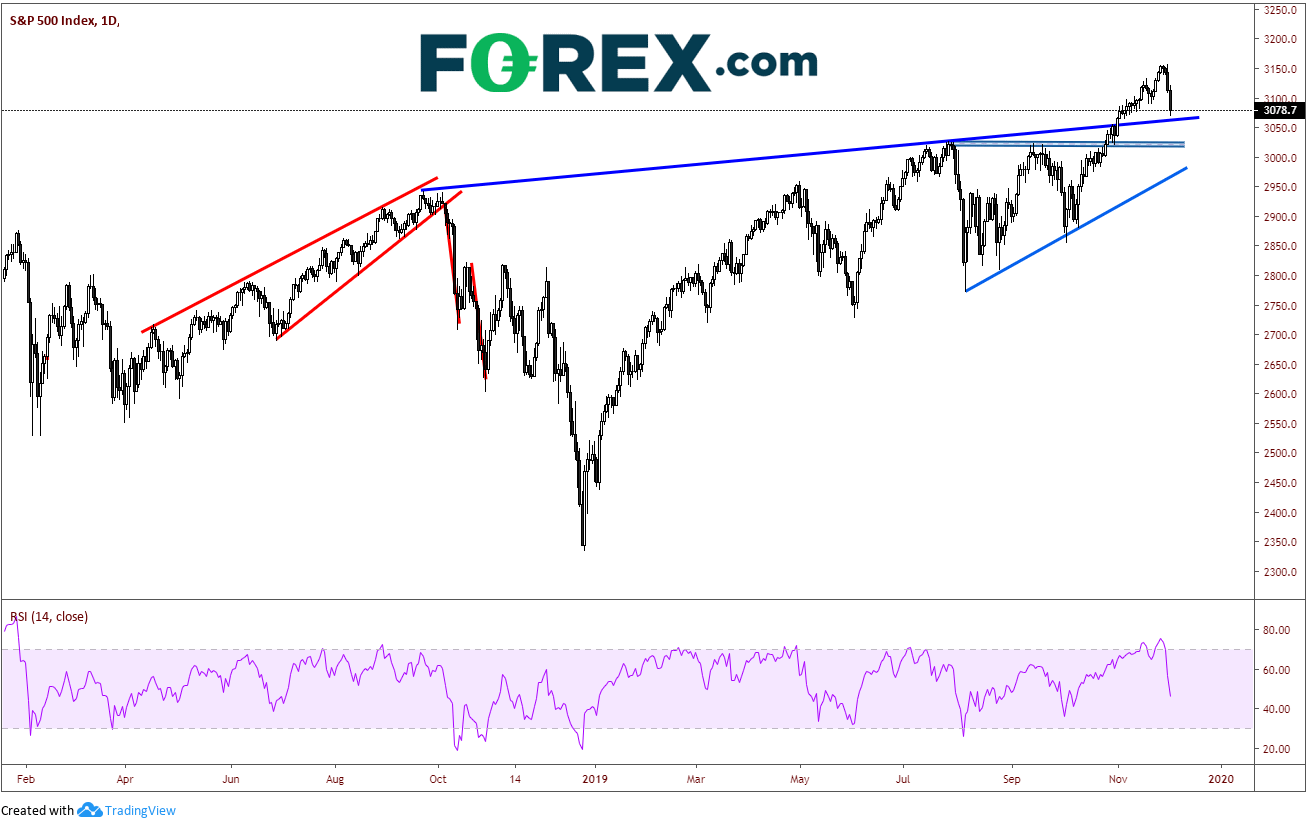
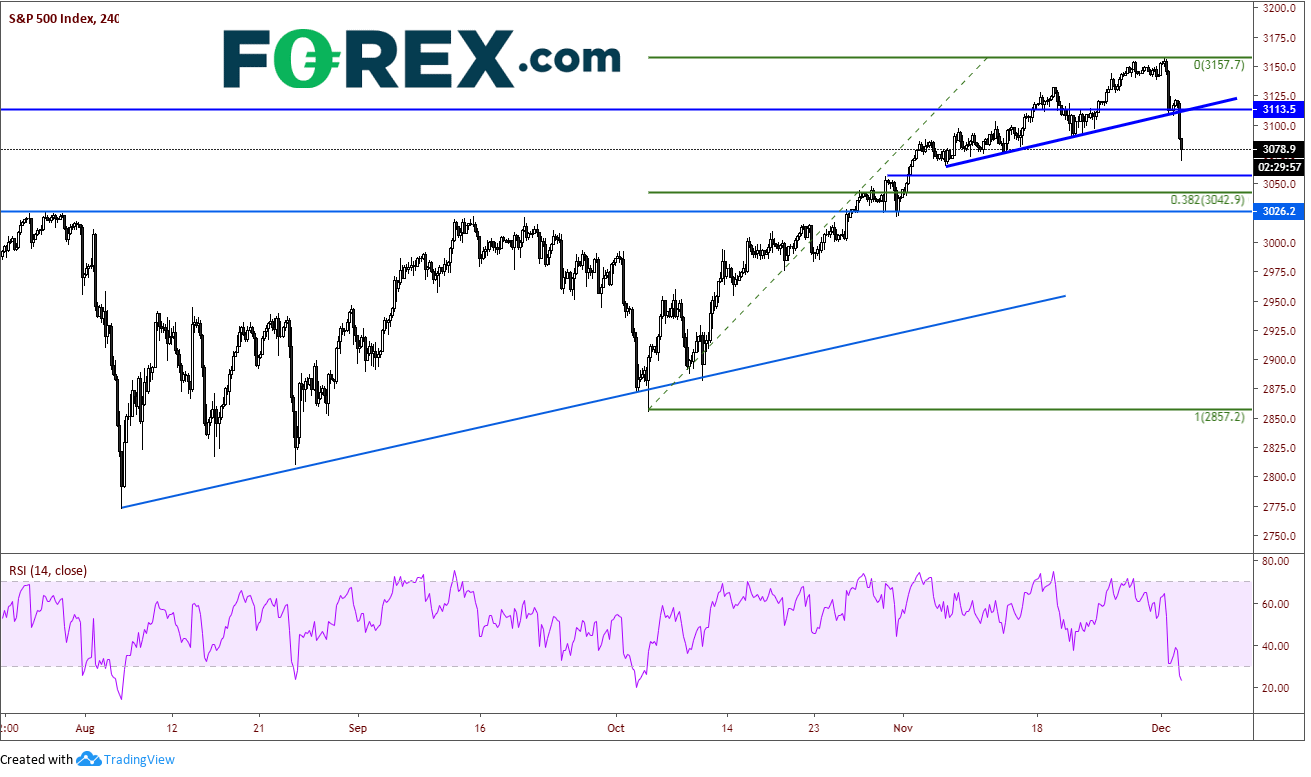
Although the S&P 500 is down nearly 80 handles in two days, price still has room to run down towards 3065, which is the upward sloping trendline dating back to September 2018. There is also horizontal support just below that level near 3060. Psychological resistance now comes across back at 3100, and then horizontal and trendline resistance on the 240-minute timeframe near 3113.
Source: Tradingview, FOREX.com
However, there is one big difference between yesterday and today in terms of market action. Yesterday the DXY participated and sold off. The bond market was relatively muted. Today, the bond market is rallying and the DXY is close to unchanged. Bond prices and yields are inversely related, so as bond prices go bid, yields move lower. US 10 Year Yields are down nearly -5.7% at 1.72. This is the third time yields have tested this level, as it is the 50% retracement level from the lows on October 8th to the highs on November 7th. If bonds continue to rally, yields will continue to fall. The next level of support for yields is the 61.8% Fibonacci retracement level of the previously mentioned timeframe at 1.684.
Source: Tradingview, FOREX.com
As the markets are currently in risk off mode, watch for comments and headlines to try and soften the blow of the tariffs and the possible US-China trade deal delay. With the markets down about 2% in two days, support levels may hold as the market takes a breather ahead of ADP payrolls tomorrow and NFP on Friday.
Latest market news




The complete CFD trading experience
Award-winning platforms, competitive spreads, low commissions and dedicated support.
We live and breathe the markets and are dedicated to helping traders realise their ambitions as we continue to set the industry bar.
Economic calendar
Web Trader platform
Our sophisticated web-based platform is packed with features.
Related articles
GBP/USD forecast: US dollar surges as bonds implode
The US dollar continued to press higher deep into the European session, supported by the slump in the bond markets as yields broke out across the curve. Following the recent hawkish Fed rate hike, yield spreads between the US and the rest of the world has continually increased, and that motion continued today, helped in part by some forecast-beating US macro data and hawkish Fed commentary.
Gold Analysis: Rising Yields and Dollar Strength Weigh on XAU/USD
The trading week continues, and for now gold remains under notable pressure in the short term. This can be seen in the performance of XAU/USD over the last three trading sessions, where the metal has declined by more than 2.00%, bringing a bearish bias back into focus after it had lost momentum in recent weeks.

Australian Dollar Technical Outlook: AUD/USD Breakdown Threatens Deeper Correction 9 23 2026
AUD/USD remains under pressure after breaking key trend support, with the latest decline putting the focus on the next major downside pivot.

StoneX Europe Ltd may make third party material available on this website which may contain information included but not limited to the conditions of financial markets. The material is for information purposes only and does not contain, and should not be construed as containing, investment advice and/or investment recommendation and/or an investment research and/or an offer of or solicitation for any transactions in financial instruments; any decision to enter into a specific transaction shall be made by the client following an assessment by him/her of their situation.
StoneX Europe Ltd makes no representation or warranty and assumes no liability as to the accuracy or completeness of the information provided, nor any loss arising from any investment based on a recommendation, forecast or other information supplied. You should always seek independent advice as to your suitability to speculate in any related markets and your ability to assume the associated risks, if you are at all unsure. We are not under any obligation to update any such material. Any opinion made may be personal to the author and may not reflect the opinion of StoneX Europe Ltd.