




Technical view Nasdaq stumbles hinting at a potential nearterm top
Long-time bulls should certainly have their guards up after today’s price action...
Share this:

For over a year now, the big technology stocks that make up the Nasdaq 100 have been essentially a one-way trade to the upside, and any traders betting against that trend have been run over. Despite that backdrop, today’s price action is certainly ringing some alarm bells, at least in the short term, for Nasdaq 100 bulls.
Midway through last month, things were looking up: The Nasdaq 100 had just broken out to a fresh record high above $337 after finding support near its 100-day EMA in late March, and earnings expectations were high for the big tech behemoths that drive the index. Though we ultimately saw the four biggest holdings in the index (Appl, Microsoft, Amazon, and Alphabet/Google, together accounting for more than 33% of its value) crush analysts’ earnings estimates, those stocks generally saw only a lackluster reaction to the bullish fundamental news.
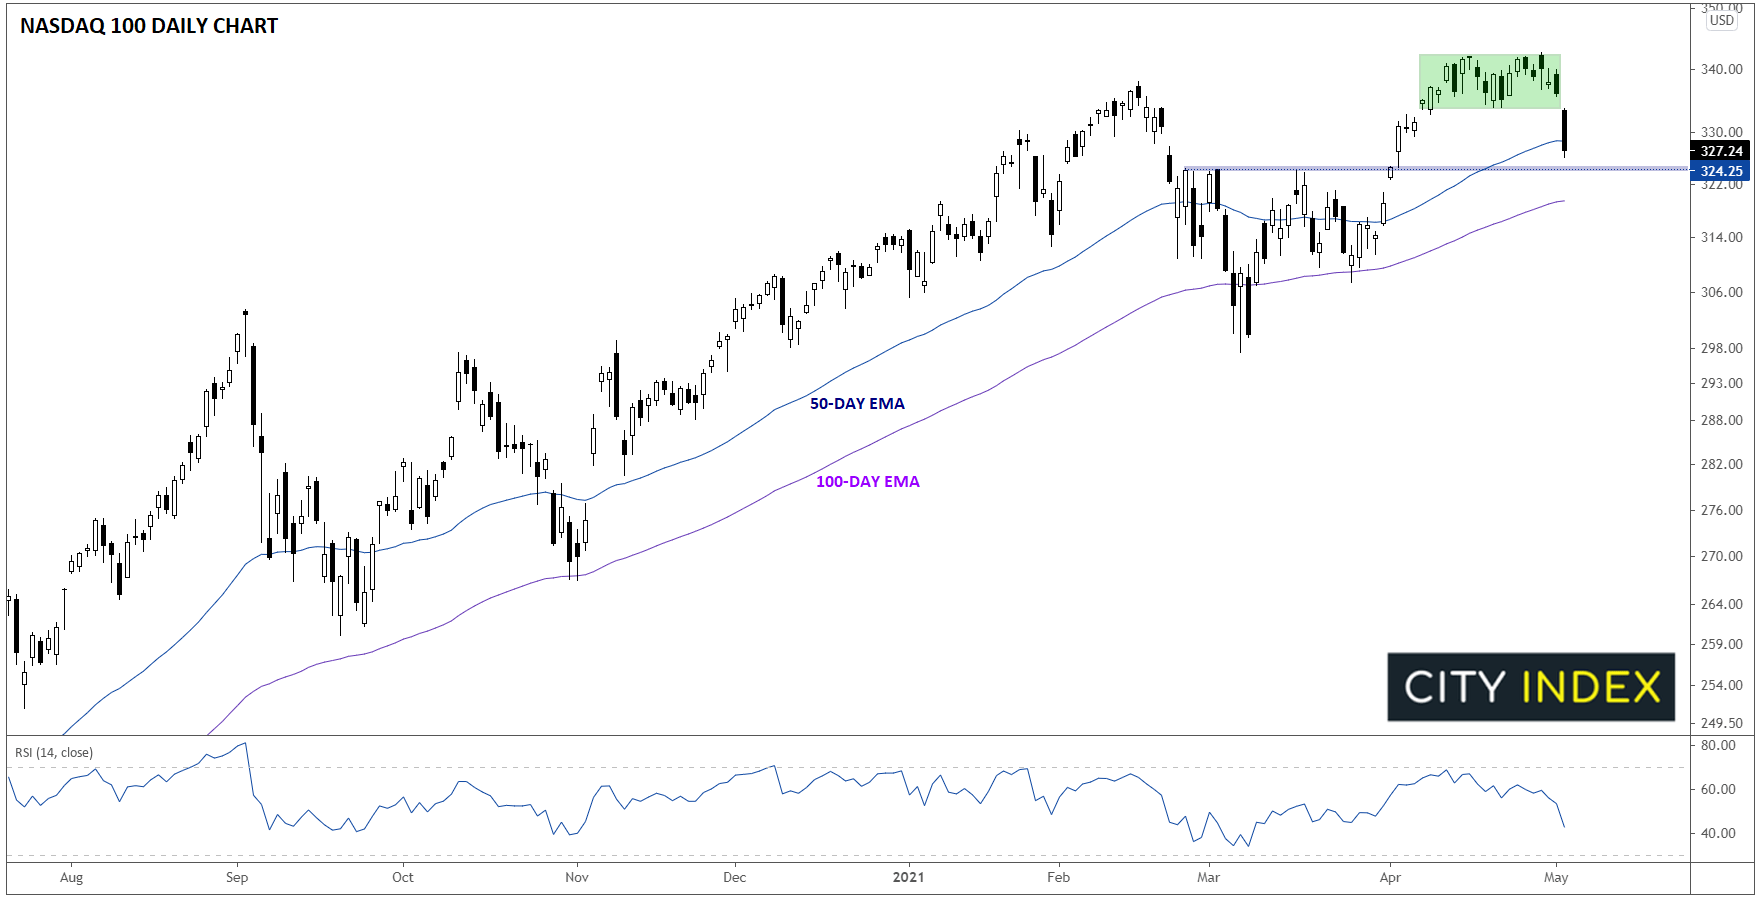
From a technical perspective, the Nasdaq 100 spent the last two weeks consolidating right at the previous highs as traders fought over whether the long-term uptrend could extend further. Today’s big bearish move has provided at least a short-term answer: No.
April’s “fakeout breakout” was also accompanied by a bearish divergence in the 14-day RSI indicator, showing declining buying pressure despite the modest new high in the underlying index price. This development suggests that the index may be ripe for a deeper retracement before fresh buyers can be found. Looking at the chart below, the Nasdaq 100 has already fallen below its 50-day EMA, opening the door for a continuation down toward previous-resistance-turned-support near $324.25 or the 100-day EMA near $320 next.
Source: TradingView, StoneX
A sustained break below that rising support line, if seen, would mark a change in the character of the established uptrend and could have longer-term bearish ramifications for the widely-followed index. Either way, long-time bulls should certainly have their guards up after today’s price action unless and until the Nasdaq 100 is able to definitively clear overhead resistance near $340.
Learn more about index trading opportunities.
For over a year now, the big technology stocks that make up the Nasdaq 100 have been essentially a one-way trade to the upside, and any traders betting against that trend have been run over. Despite that backdrop, today’s price action is certainly ringing some alarm bells, at least in the short term, for Nasdaq 100 bulls.
Midway through last month, things were looking up: The Nasdaq 100 had just broken out to a fresh record high above $337 after finding support near its 100-day EMA in late March, and earnings expectations were high for the big tech behemoths that drive the index. Though we ultimately saw the four biggest holdings in the index (Appl, Microsoft, Amazon, and Alphabet/Google, together accounting for more than 33% of its value) crush analysts’ earnings estimates, those stocks generally saw only a lackluster reaction to the bullish fundamental news.
From a technical perspective, the Nasdaq 100 spent the last two weeks consolidating right at the previous highs as traders fought over whether the long-term uptrend could extend further. Today’s big bearish move has provided at least a short-term answer: No.
April’s “fakeout breakout” was also accompanied by a bearish divergence in the 14-day RSI indicator, showing declining buying pressure despite the modest new high in the underlying index price. This development suggests that the index may be ripe for a deeper retracement before fresh buyers can be found. Looking at the chart below, the Nasdaq 100 has already fallen below its 50-day EMA, opening the door for a continuation down toward previous-resistance-turned-support near $324.25 or the 100-day EMA near $320 next.
Source: TradingView, StoneX
A sustained break below that rising support line, if seen, would mark a change in the character of the established uptrend and could have longer-term bearish ramifications for the widely-followed index. Either way, long-time bulls should certainly have their guards up after today’s price action unless and until the Nasdaq 100 is able to definitively clear overhead resistance near $340.
Learn more about index trading opportunities.
Related tags:
Latest market news




The complete CFD trading experience
Award-winning platforms, competitive spreads, low commissions and dedicated support.
We live and breathe the markets and are dedicated to helping traders realise their ambitions as we continue to set the industry bar.
Economic calendar
Web Trader platform
Our sophisticated web-based platform is packed with features.
Related articles
S&P 500 Forecast: SPX Continues to Drift Away from Record Highs
Recent trading sessions have done little to restore confidence in the equity market. Over the last four sessions, the S&P 500 has declined by nearly 1.00%, a move that highlights growing short-term weakness and keeps the index moving further away from its record-high territory.
Nasdaq Breakout Potential into Q4 for Melt Up Scenarios
The headlines seem negative in almost any place that you look, with surging Treasury yields and frothy AI valuations getting more and more attention. But, if it’s so bad, why hasn’t the Nasdaq melted down yet, even as the Fed has started hiking rates?


The RBA Hiked Rates and the Australian Dollar Still Fell
AUD/USD fell after the RBA rate hike because the central bank's hawkish stance was already priced in while the U.S. dollar stayed firm.

StoneX Europe Ltd may make third party material available on this website which may contain information included but not limited to the conditions of financial markets. The material is for information purposes only and does not contain, and should not be construed as containing, investment advice and/or investment recommendation and/or an investment research and/or an offer of or solicitation for any transactions in financial instruments; any decision to enter into a specific transaction shall be made by the client following an assessment by him/her of their situation.
StoneX Europe Ltd makes no representation or warranty and assumes no liability as to the accuracy or completeness of the information provided, nor any loss arising from any investment based on a recommendation, forecast or other information supplied. You should always seek independent advice as to your suitability to speculate in any related markets and your ability to assume the associated risks, if you are at all unsure. We are not under any obligation to update any such material. Any opinion made may be personal to the author and may not reflect the opinion of StoneX Europe Ltd.