






The Collapse of the Mexican Peso
As the selloff continued in global stocks, the Mexican Peso continued lower vs the US Dollar.
Share this:

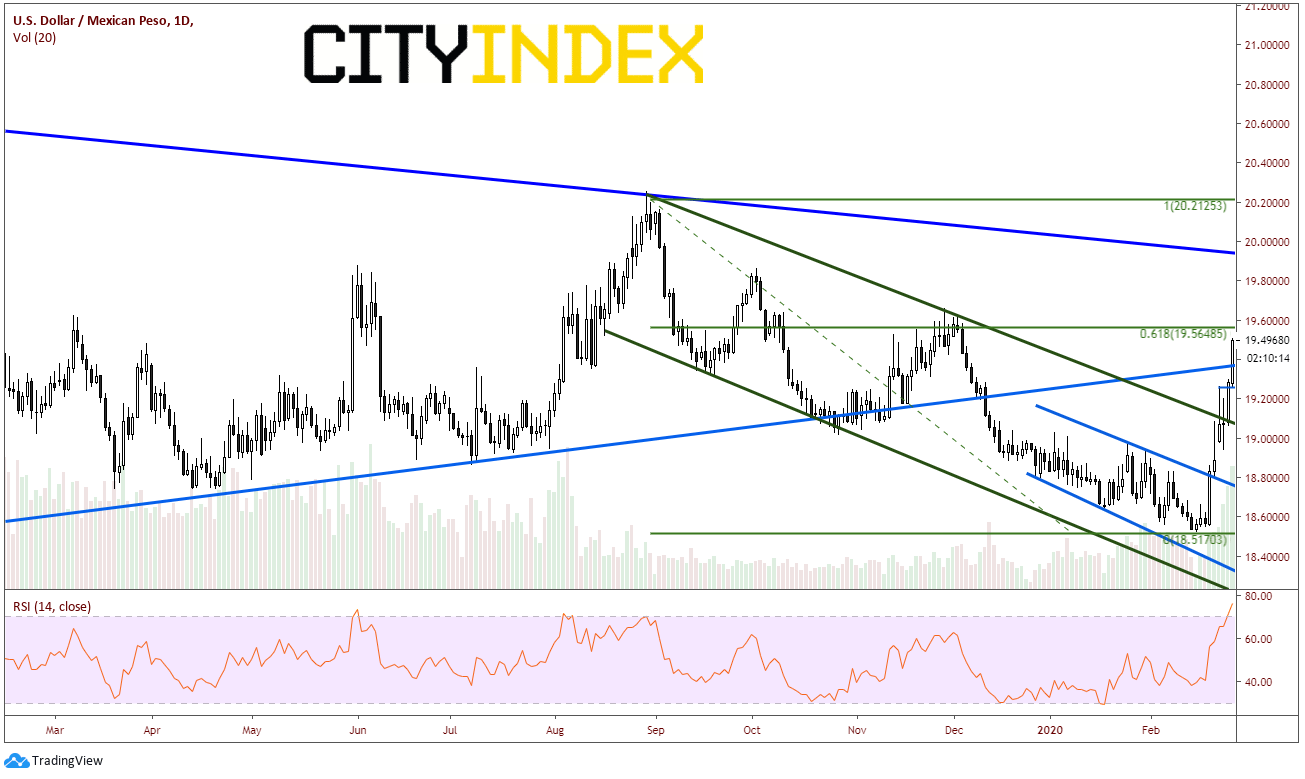
In what feels like years ago, on February 27th, we wrote about the fall of the Mexican Peso. Fundamentally, we discussed how USD/MXN was heading higher as the carry trade was being unwound. As stocks moved lower, traders had to sell pesos and buy back US Dollar and Euros. As a result, both USD/MXN and EUR/MXN both were moving higher. Technically, price of USD/MXN had broken out of 2 channels, back inside a long-term triangle, and had stalled near the 61.8% Fibonacci retracement level from the August 29th, 2019 highs to the February 17th lows. The RSI was overbought, but we discussed how it could become “more overbought”. This is how the chart looked on February 27th:
Source: Tradingview, City Index
As the selloff continued in global stock markets throughout the month of March, Emerging Market currencies, in general, continued to move lower vs the USD. In particular, the USD/MXN shot higher as demand for US Dollars increased significantly. Although the US Fed flooded the markets with US Dollars and created additional swap lines to provide US dollar liquidity to Mexico, the fear of uncertainty surrounding the coronavirus and the US economy caused traders to flee Mexican pesos. In addition, the Central Bank of Mexico held an emergency meeting of its own on March 20th and cut the benchmark by 50bps to 6.5%. This past weekend, President Trump also closed the US-Mexico border.
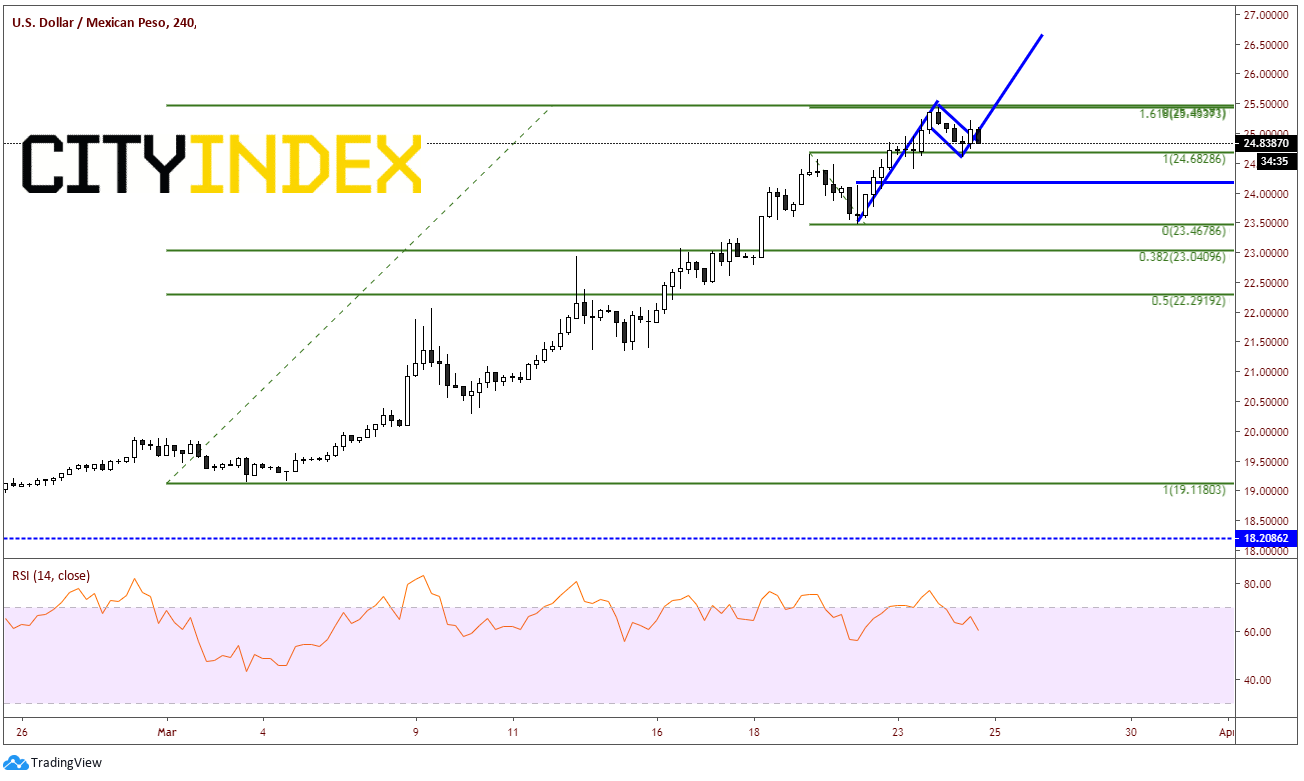
Below is an updated chart of the USD/MXN. As stocks moved lower, the emerging market pair continued to move higher. On March 3rd , price put in a low of 19.1509 and it was off to the races. Since then, USD/MXN has rallied almost 33% to an all-time high today of 25.4474, however has since pulled back slightly to 24.9228 as stock markets rallied today. Notice how RSI did pull back for a short amount of time into the neutral area but reached a high yesterday of 95.97.
Source: Tradingview, City Index
Initial horizontal support comes in 24.9557. If today’s high is to be the high for a while, we can begin to look for Fibonacci levels below for more support. The 38.2% Fibonacci retracement level comes in near 23.0410, which is also close to horizontal support. Below that is the 50% retracement level at 22.2919. Initial resistance is at today’s highs near 25.4447. Today’s high also happens to be the 161.8% extension from the highs on March 19th to the lows on February 20th. Above that is the target for a small flag pattern that has formed over the last few days near 26.65.
Source: Tradingview, City Index
In what feels like years ago, on February 27th, we wrote about the fall of the Mexican Peso. Fundamentally, we discussed how USD/MXN was heading higher as the carry trade was being unwound. As stocks moved lower, traders had to sell pesos and buy back US Dollar and Euros. As a result, both USD/MXN and EUR/MXN both were moving higher. Technically, price of USD/MXN had broken out of 2 channels, back inside a long-term triangle, and had stalled near the 61.8% Fibonacci retracement level from the August 29th, 2019 highs to the February 17th lows. The RSI was overbought, but we discussed how it could become “more overbought”. This is how the chart looked on February 27th:
Source: Tradingview, FOREX.com
As the selloff continued in global stock markets throughout the month of March, Emerging Market currencies, in general, continued to move lower vs the USD. In particular, the USD/MXN shot higher as demand for US Dollars increased significantly. Although the US Fed flooded the markets with US Dollars and created additional swap lines to provide US dollar liquidity to Mexico, the fear of uncertainty surrounding the coronavirus and the US economy caused traders to flee Mexican pesos. In addition, the Central Bank of Mexico held an emergency meeting of its own on March 20th and cut the benchmark by 50bps to 6.5%. This past weekend, President Trump also closed the US-Mexico border.
Below is an updated chart of the USD/MXN. As stocks moved lower, the emerging market pair continued to move higher. On March 3rd , price put in a low of 19.1509 and it was off to the races. Since then, USD/MXN has rallied almost 33% to an all-time high today of 25.4474, however has since pulled back slightly to 24.9228 as stock markets rallied today. Notice how RSI did pull back for a short amount of time into the neutral area but reached a high yesterday of 95.97.
Source: Tradingview, FOREX.com
Initial horizontal support comes in 24.9557. If today’s high is to be the high for a while, we can begin to look for Fibonacci levels below for more support. The 38.2% Fibonacci retracement level comes in near 23.0410, which is also close to horizontal support. Below that is the 50% retracement level at 22.2919. Initial resistance is at today’s highs near 25.4447. Today’s high also happens to be the 161.8% extension from the highs on March 19th to the lows on February 20th. Above that is the target for a small flag pattern that has formed over the last few days near 26.65.
Source: Tradingview, FOREX.com
Related tags:
Latest market news




The complete CFD trading experience
Award-winning platforms, competitive spreads, low commissions and dedicated support.
We live and breathe the markets and are dedicated to helping traders realise their ambitions as we continue to set the industry bar.
Economic calendar
Web Trader platform
Our sophisticated web-based platform is packed with features.
Related articles
Euro Forecast: EUR/USD Tumbles Towards Yearly Low as Daily RSI Goes Oversold
EUR/USD has been hit hard in the final month of the quarter as USD strength has shown up in a big way. With the pair set to challenge its yearly low as RSI has pushed into oversold territory, is there a chance for a pullback with some big headline risk hitting in the US over the next few days?
AUD/USD outlook: Aussie slips despite hawkish RBA ahead of key data
The AUD/USD was unable to benefit from the Reserve Bank of Australia’s 25-basis-point rate hike overnight. The RBA lifted the cash rate to 4.60%, in line with expectations. However, the Australian dollar weakened following the decision, with much of the Bank’s hawkish stance seemingly priced in ahead of the announcement. The US dollar has also remained largely supported following the recent turmoil in the bond markets.

Canadian Dollar Technical Outlook: USD/CAD Seven-Day Rally Tests Major Resistance 9 29 2026
USD/CAD is pressing into a major technical barrier after an extended advance, raising the risk for price inflection as momentum stretches.

StoneX Europe Ltd may make third party material available on this website which may contain information included but not limited to the conditions of financial markets. The material is for information purposes only and does not contain, and should not be construed as containing, investment advice and/or investment recommendation and/or an investment research and/or an offer of or solicitation for any transactions in financial instruments; any decision to enter into a specific transaction shall be made by the client following an assessment by him/her of their situation.
StoneX Europe Ltd makes no representation or warranty and assumes no liability as to the accuracy or completeness of the information provided, nor any loss arising from any investment based on a recommendation, forecast or other information supplied. You should always seek independent advice as to your suitability to speculate in any related markets and your ability to assume the associated risks, if you are at all unsure. We are not under any obligation to update any such material. Any opinion made may be personal to the author and may not reflect the opinion of StoneX Europe Ltd.