



This Stock Shock too shall pass
Stock market logic and precedent point to shrugging off Middle East risk, for a spell
Share this:

Stock market logic and precedent point to shrugging off Middle East risk, for a spell
Much remains uncertain about how the killing of Iran’s top commander, Qassem Soleimani will play out for markets. What is clear though is that most analysts – this one included—failed to flag a potential sudden and serious escalation of tensions into forecasts of the year ahead. The scarcity of mentions of that possibility in voluminous ‘2020 outlook’ notes was striking. Even after the devastating attack on Saudi Arabia’s largest oil processing plant in September that Washington blamed on Iran, forecasters generally shied away from flagging that material risk could quickly become heightened. Understandably, the biggest influences on risky assets in the year ahead were summed up by forecasters as 1. A phase one trade deal that removes one of investors’ biggest bugbears 2. Accommodative monetary policy. The notion that investors were blindsided last week helps account for the swift reaction that erased all gains made during a strikingly sure-footed first session of the year. The obvious question is ‘what now’?
An obvious answer is that it’s too early to know. Also, that although tempting to rush into oil and gold stocks drop everything that isn’t a ‘haven’, the chance of errors tends to rise exponentially from that approach. For instance, even screening for the most underappreciated oil shares—say those with the lowest P/E ratios and highest free cash flow—would still offer little justification for pricing $60/bbl.-plus oil into valuations for the long term.
At the same time, the probability of some sort of retaliation from Iran, in keeping with the Islamic Republic’s pattern of behaviour established over many decades, seems greater than the chance that it won’t live up to its repeated threat to do just that. The uncertainty is more about ‘when’ rather than ‘if’. That leaves two basic pathways that reaction to ‘Middle East risk’ may take. Is it to be the often observed (and usually rapid) rebound to some sort of normality? Or could the current reversal deepen into one that begins to look more meaningful?
Another easy (too facile) answer: ‘how about both?’ To begin to answer why, we can assume that, so far, few major investors have adjusted quantitative models significantly (or seen their algorithms adjust themselves) based on Friday’s events. As such, planned asset allocation on Monday is very likely to be near-identical to plans as they stood on Thursday. That leads us back to what forecasters will still probably get right in 2020: the loose global policy environment isn’t going anywhere anytime soon. Note New York Fed President John Williams’ timely assurance earlier that low rates are here to stay. And as we saw last year, when stock markets advanced to one of their best gains of the 2010s, easy money covers a multitude of sins. More empirically, economics, revenues and earnings tend to trump all over time. Maybe we can’t quite downgrade everything else as ‘noise’, but relatively speaking, that’s often how it turns out.
In short, a period of continued risk aversion, albeit as yet tricky to define, followed in relatively short order by the resumption of risk appetite appears more probable than protracted declines. However, if or when a form of retaliation appears—assuming it does not do so imminently—depending on the nature of that response, risk-off may return. In a year that has already demonstrated once again the ultimate futility of forecasts, that’s about as far as it makes sense to go.
Long-term technical analysis only seems to echo that a sizeable correction, when it does occur, could be disruptive. However, even then, a long-term regression study of the S& P 500 clearly suggests some containment.
Chart notes
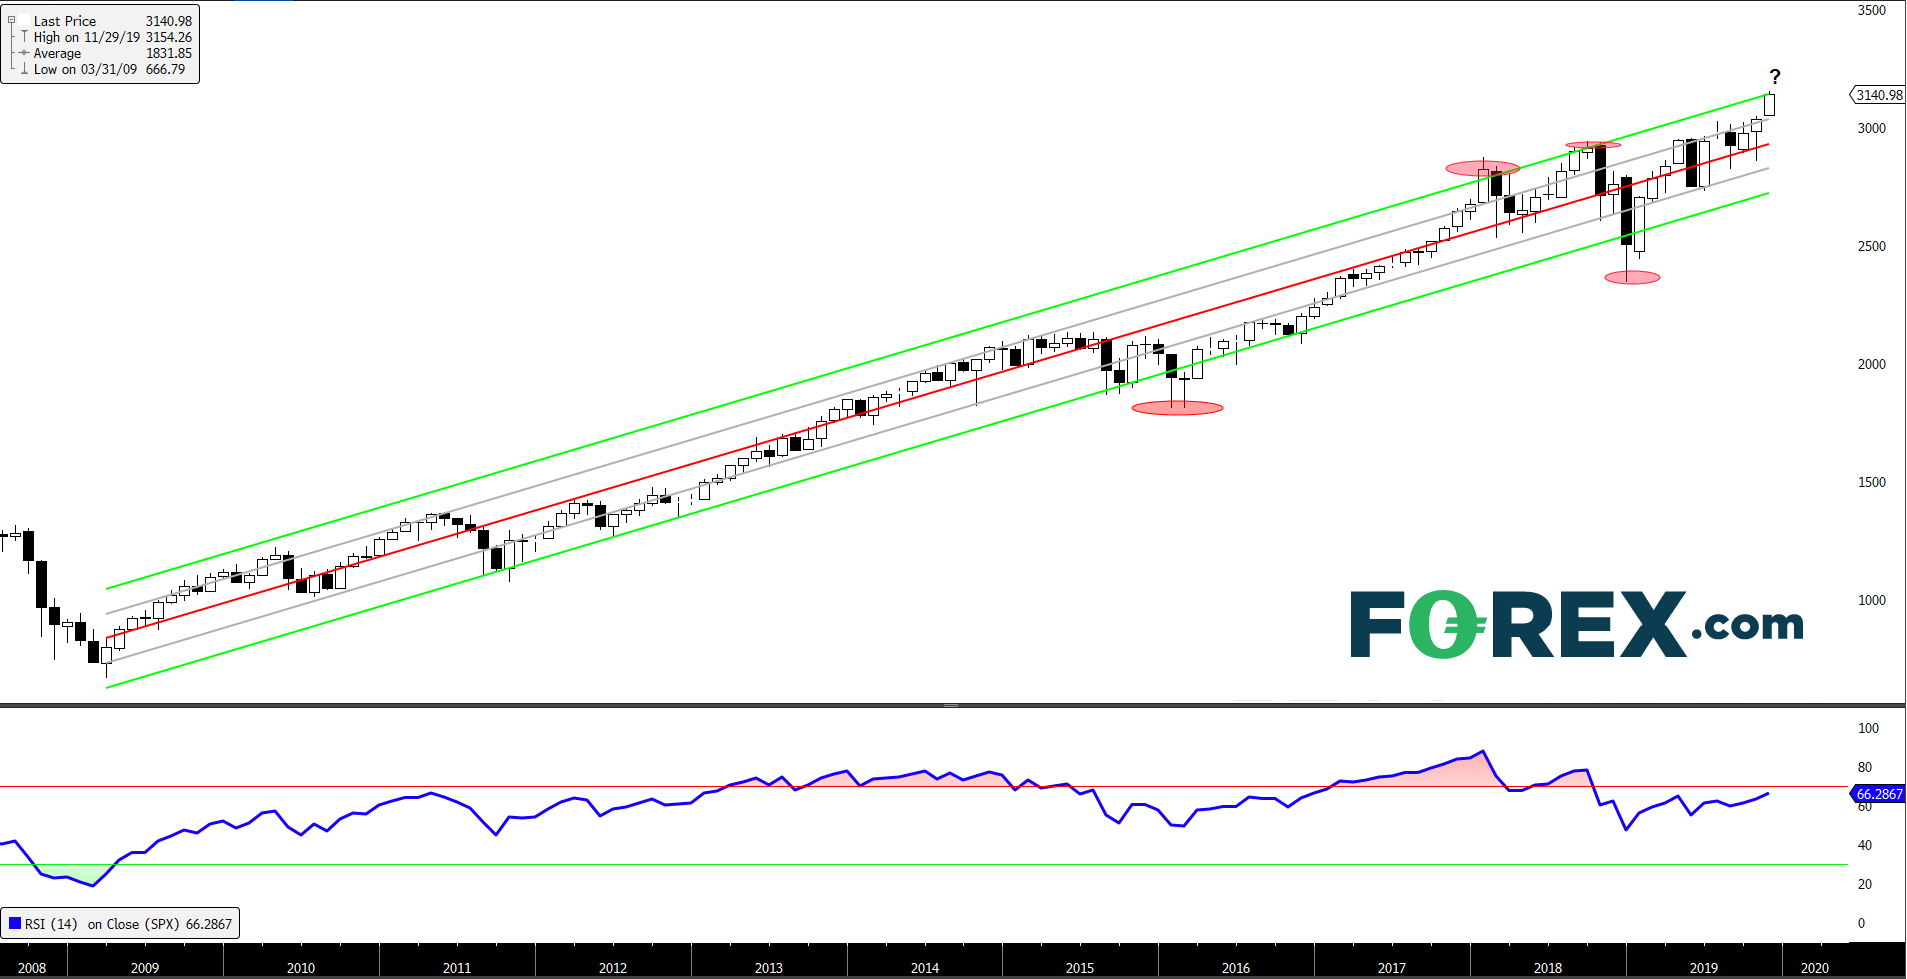
- Note that the central regression line in the chart below begins at the high of March 2009 when the S&P 500 established a base from the global financial crisis sell-off. Two standard deviations are plotted on either side. A swing of two standard deviations either upwards or downwards is considered to be statistically remarkable
- It is self-evident that the market rarely transgressed the regression channel by two standard deviations last decade. Early 2016 and late 2018 standout on the downside (see ellipses). Topside infractions were shallower
- But the S&P 500 index is currently two upper standard deviations above its secular regression line. A correction is possible within a few months, but such a downswing in itself cannot forecast the end of the 10-years-long-plus rising trend
S&P 500 monthly chart with regression analysis 06/01/2020 17:02:09
Source: FOREX.com
Stock market logic and precedent point to shrugging off Middle East risk, for a spell
Much remains uncertain about how the killing of Iran’s top commander, Qassem Soleimani will play out for markets. What is clear though is that most analysts – this one included—failed to flag a potential sudden and serious escalation of tensions into forecasts of the year ahead. The scarcity of mentions of that possibility in voluminous ‘2020 outlook’ notes was striking. Even after the devastating attack on Saudi Arabia’s largest oil processing plant in September that Washington blamed on Iran, forecasters generally shied away from flagging that material risk could quickly become heightened. Understandably, the biggest influences on risky assets in the year ahead were summed up by forecasters as 1. A phase one trade deal that removes one of investors’ biggest bugbears 2. Accommodative monetary policy. The notion that investors were blindsided last week helps account for the swift reaction that erased all gains made during a strikingly sure-footed first session of the year. The obvious question is ‘what now’?
An obvious answer is that it’s too early to know. Also, that although tempting to rush into oil and gold stocks drop everything that isn’t a ‘haven’, the chance of errors tends to rise exponentially from that approach. For instance, even screening for the most underappreciated oil shares—say those with the lowest P/E ratios and highest free cash flow—would still offer little justification for pricing $60/bbl.-plus oil into valuations for the long term.
At the same time, the probability of some sort of retaliation from Iran, in keeping with the Islamic Republic’s pattern of behaviour established over many decades, seems greater than the chance that it won’t live up to its repeated threat to do just that. The uncertainty is more about ‘when’ rather than ‘if’. That leaves two basic pathways that reaction to ‘Middle East risk’ may take. Is it to be the often observed (and usually rapid) rebound to some sort of normality? Or could the current reversal deepen into one that begins to look more meaningful?
Another easy (too facile) answer: ‘how about both?’ To begin to answer why, we can assume that, so far, few major investors have adjusted quantitative models significantly (or seen their algorithms adjust themselves) based on Friday’s events. As such, planned asset allocation on Monday is very likely to be near-identical to plans as they stood on Thursday. That leads us back to what forecasters will still probably get right in 2020: the loose global policy environment isn’t going anywhere anytime soon. Note New York Fed President John Williams’ timely assurance earlier that low rates are here to stay. And as we saw last year, when stock markets advanced to one of their best gains of the 2010s, easy money covers a multitude of sins. More empirically, economics, revenues and earnings tend to trump all over time. Maybe we can’t quite downgrade everything else as ‘noise’, but relatively speaking, that’s often how it turns out.
In short, a period of continued risk aversion, albeit as yet tricky to define, followed in relatively short order by the resumption of risk appetite appears more probable than protracted declines. However, if or when a form of retaliation appears—assuming it does not do so imminently—depending on the nature of that response, risk-off may return. In a year that has already demonstrated once again the ultimate futility of forecasts, that’s about as far as it makes sense to go.
Long-term technical analysis only seems to echo that a sizeable correction, when it does occur, could be disruptive. However, even then, a long-term regression study of the S& P 500 clearly suggests some containment.
Chart notes
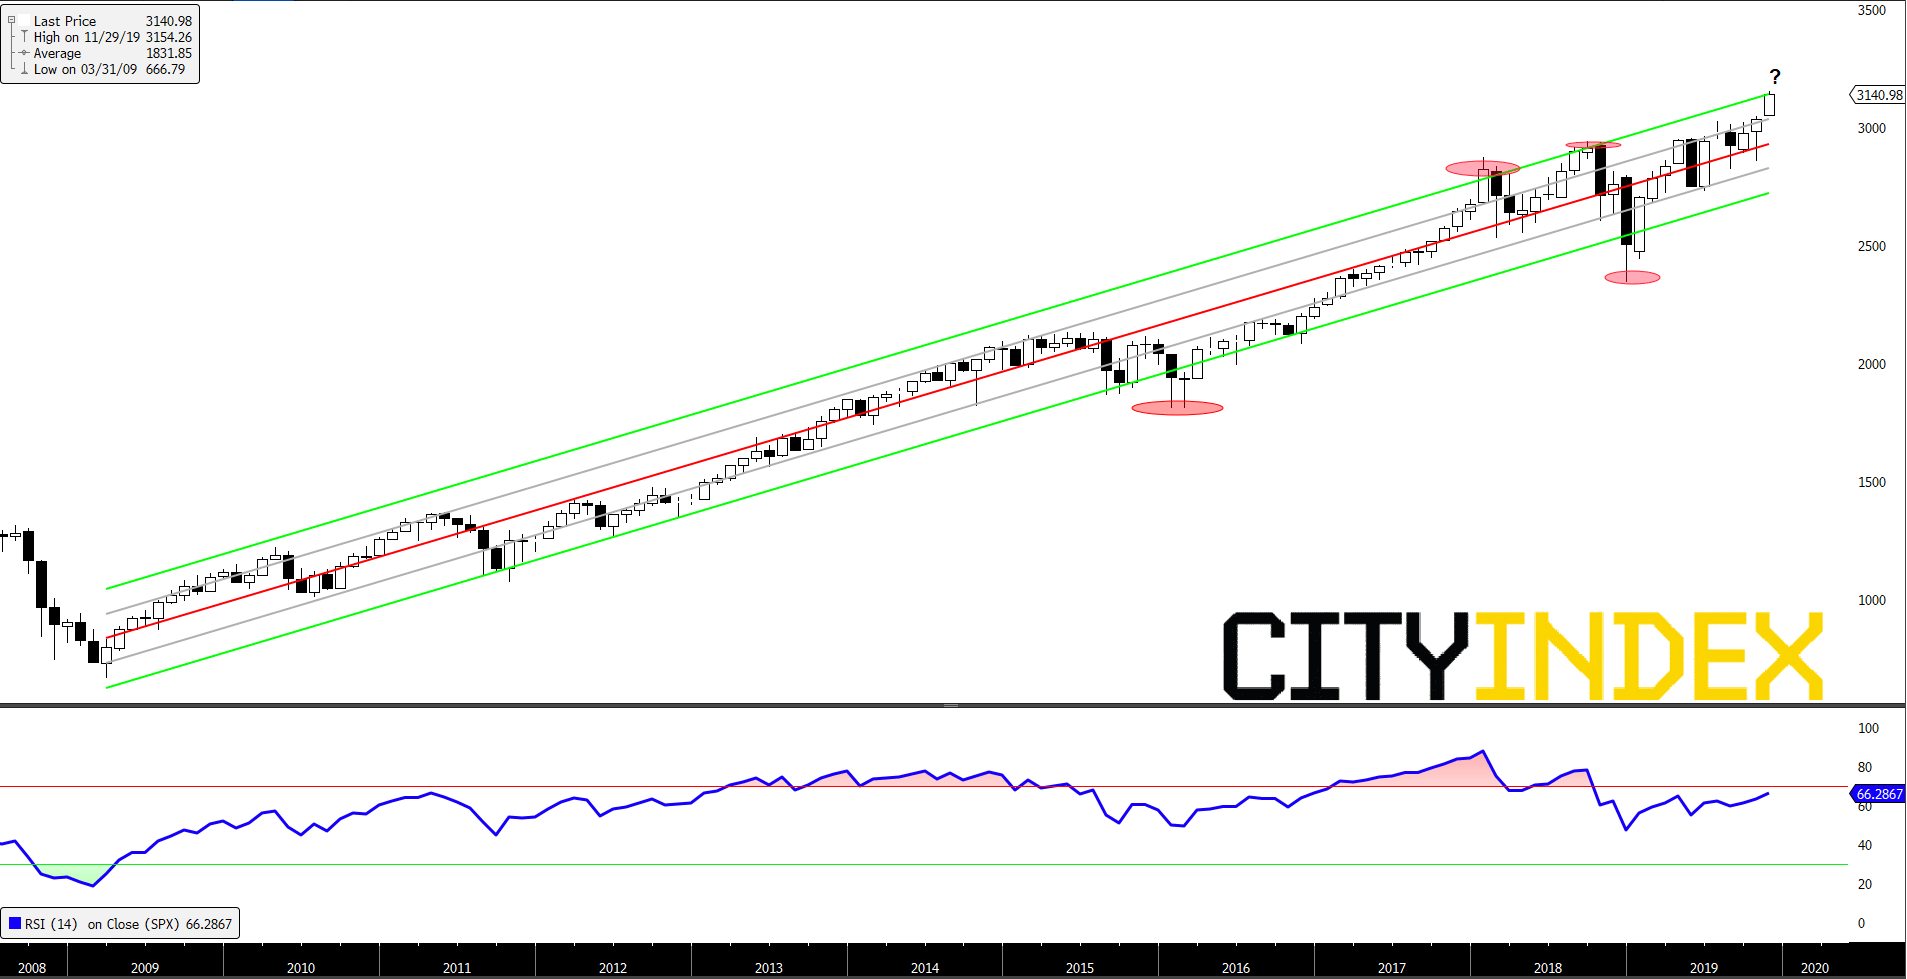
- Note that the central regression line in the chart below begins at the high of March 2009 when the S&P 500 established a base from the global financial crisis sell-off. Two standard deviations are plotted on either side. A swing of two standard deviations either upwards or downwards is considered to be statistically remarkable
- It is self-evident that the market rarely transgressed the regression channel by two standard deviations last decade. Early 2016 and late 2018 standout on the downside (see ellipses). Topside infractions were shallower
- But the S&P 500 index is currently two upper standard deviations above its secular regression line. A correction is possible within a few months, but such a downswing in itself cannot forecast the end of the 10-years-long-plus rising trend
S&P 500 monthly chart with regression analysis 06/01/2020 17:02:09
Source: City Index
Latest market news




The complete CFD trading experience
Award-winning platforms, competitive spreads, low commissions and dedicated support.
We live and breathe the markets and are dedicated to helping traders realise their ambitions as we continue to set the industry bar.
Economic calendar
Web Trader platform
Our sophisticated web-based platform is packed with features.
Related articles

S&P 500 forecast: Stocks extend drop as correction risks grow
US and global equity markets have extended Wednesday’s sell-off, with Wall Street opening lower after a weak handover from Asia and Europe. The deterioration in risk appetite has been spreading across global markets. The dollar was firmer, Treasury yields were holding onto yesterday’s gains, while gold, silver and bitcoin were all under pressure alongside equities and major currencies.


EUR/USD Update: Will Fed Expectations Keep Pressure on the Euro?
The week continues to present challenges for the euro's short-term strength. This is reflected in the recent performance of EUR/USD, which has declined by nearly 0.6% over the last three trading sessions


Nikkei threatens breakout as tech rebound broadens
Breakouts across the SOX and Nasdaq are being matched by rebounds across Asia, with the Nikkei now threatening to join the move.
StoneX Europe Ltd may make third party material available on this website which may contain information included but not limited to the conditions of financial markets. The material is for information purposes only and does not contain, and should not be construed as containing, investment advice and/or investment recommendation and/or an investment research and/or an offer of or solicitation for any transactions in financial instruments; any decision to enter into a specific transaction shall be made by the client following an assessment by him/her of their situation.
StoneX Europe Ltd makes no representation or warranty and assumes no liability as to the accuracy or completeness of the information provided, nor any loss arising from any investment based on a recommendation, forecast or other information supplied. You should always seek independent advice as to your suitability to speculate in any related markets and your ability to assume the associated risks, if you are at all unsure. We are not under any obligation to update any such material. Any opinion made may be personal to the author and may not reflect the opinion of StoneX Europe Ltd.