







UK Claimant Count Better than Expected
With the revision lower to December’s number, the combined 2-month total is only +8,100!
Share this:

The UK’s Claimant Count Change for January was +5,500 vs an expectation of +22,600 and a lower revised December reading of +2,600. For those keeping track at home, the claimant count measures the change in the number of unemployed over a given month. This is different than in most countries, where the change in the number of employed is measured. Therefore, a lower claimant count is better than expected and a higher claimant count is worse than expected. With the revision lower to December’s number, the combined 2-month total is only +8,100! This is stronger than any single month going back almost 2 years.
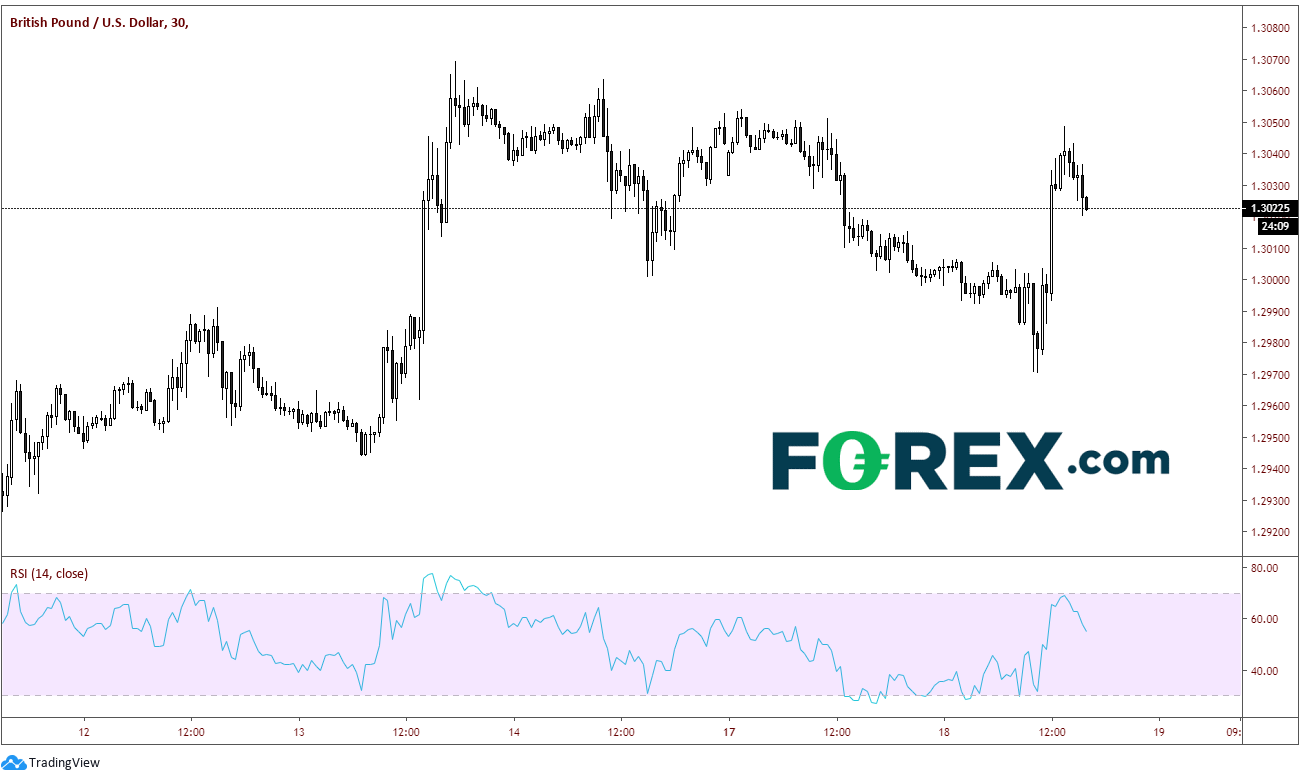
GBP/USD was already moving higher before the data, however once the pair broke through 1.3000, it was off to the races:
Source: Tradingview, City Index
Price traded as high as 1.3050 before pulling back. Resistance is 1.3050, then previous highs near 1.3070.
The move higher came despite comments yesterday from David Frost, the UK’s Brexit negotiator, that the UK will not agree to following EU regulation in exchange for a free-trade agreement and is willing to accept a degree of trade friction. (Reuters). Price action yesterday snapped a 5-day winning streak. However today, GBP/USD is on the move higher once again trying to move back inside the apex of the symmetrical triangle on the daily timeframe. Resistance on the daily now comes in at the downward sloping trendline near 1.3070 (the previous highs mentioned on the 30 minute), then horizontal resistance near 1.3200. Horizontal support is near 1.2950 and then previous daily lows near 1.2872.
Source: Tradingview, City Index
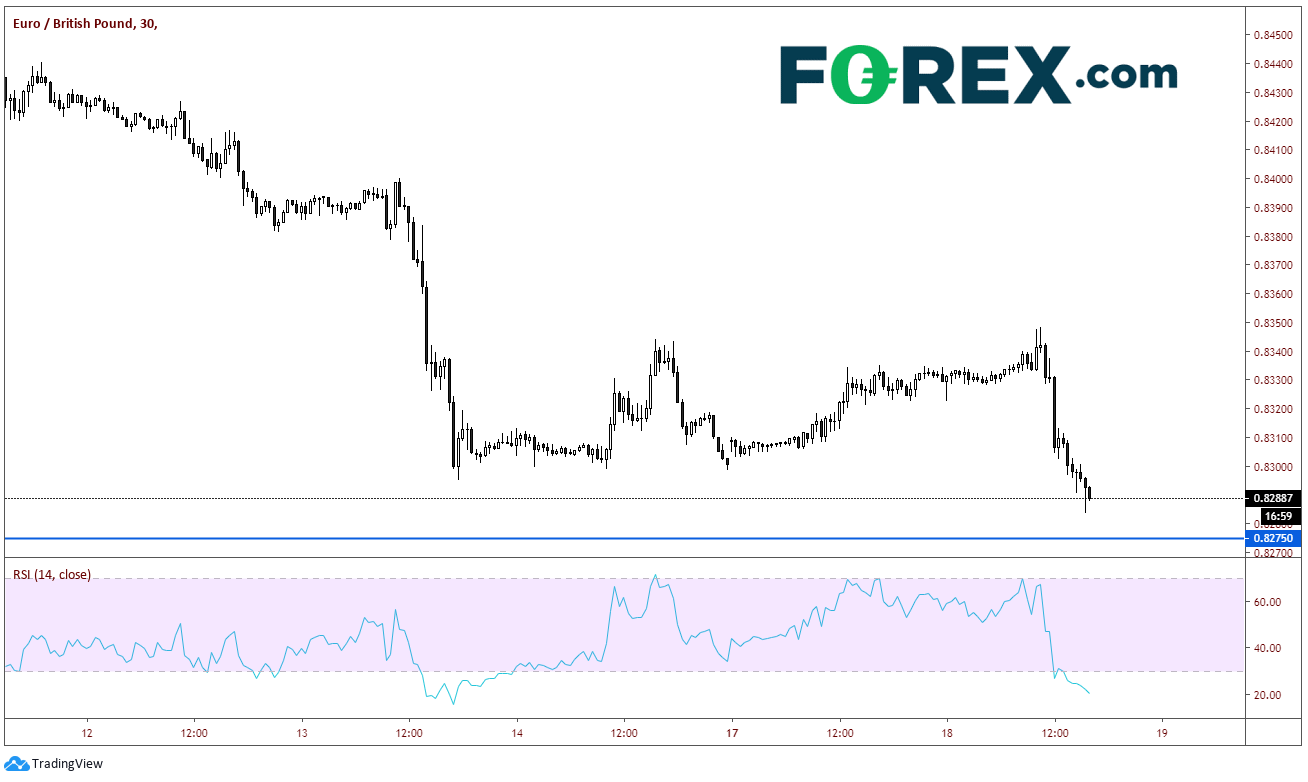
The strong move higher in the Pound can be seen in EUR/GBP as well. The pair was already moving lower (stronger GBP) into the data release. However, after the release, EUR/GBP pushed much lower and is currently testing the 2019 lows at .8275. Notice however that the RSI is near extreme oversold conditions, indicating price may be ready for a short term bounce. Sellers will look to add to positions to try and push price below .8275 looking for stops.
Source: Tradingview, City Index
And as we wrote about last week, below there is horizontal support and the 50% retracement level from the July 2015 lows to the summer 2019 highs, near .8115. Although that level is 200 pips lower, if price does reach it, there are likely to be strong buyers with ahead of that level with stops building below it. Horizontal resistance is 90 pips higher near .8375.
Source: Tradingview, City Index
Price action for the Pound is going to be more likely driven by comments regarding trade negotiations between the UK and EU (which also may keep data subdued until there are agreements). Although one data point does not make a trend, don’t be surprised to see spikes in GBP if data such as this continues to impress.
The UK’s Claimant Count Change for January was +5,500 vs an expectation of +22,600 and a lower revised December reading of +2,600. For those keeping track at home, the claimant count measures the change in the number of unemployed over a given month. This is different than in most countries, where the change in the number of employed is measured. Therefore, a lower claimant count is better than expected and a higher claimant count is worse than expected. With the revision lower to December’s number, the combined 2-month total is only +8,100! This is stronger than any single month going back almost 2 years.
GBP/USD was already moving higher before the data, however once the pair broke through 1.3000, it was off to the races:
Source: Tradingview, FOREX.com
Price traded as high as 1.3050 before pulling back. Resistance is 1.3050, then previous highs near 1.3070.
The move higher came despite comments yesterday from David Frost, the UK’s Brexit negotiator, that the UK will not agree to following EU regulation in exchange for a free-trade agreement and is willing to accept a degree of trade friction. (Reuters). Price action yesterday snapped a 5-day winning streak. However today, GBP/USD is on the move higher once again trying to move back inside the apex of the symmetrical triangle on the daily timeframe. Resistance on the daily now comes in at the downward sloping trendline near 1.3070 (the previous highs mentioned on the 30 minute), then horizontal resistance near 1.3200. Horizontal support is near 1.2950 and then previous daily lows near 1.2872.
Source: Tradingview, FOREX.com
The strong move higher in the Pound can be seen in EUR/GBP as well. The pair was already moving lower (stronger GBP) into the data release. However, after the release, EUR/GBP pushed much lower and is currently testing the 2019 lows at .8275. Notice however that the RSI is near extreme oversold conditions, indicating price may be ready for a short term bounce. Sellers will look to add to positions to try and push price below .8275 looking for stops.
Source: Tradingview, FOREX.com
And as we wrote about last week, below there is horizontal support and the 50% retracement level from the July 2015 lows to the summer 2019 highs, near .8115. Although that level is 200 pips lower, if price does reach it, there are likely to be strong buyers with ahead of that level with stops building below it. Horizontal resistance is 90 pips higher near .8375.
Source: Tradingview, FOREX.com
Price action for the Pound is going to be more likely driven by comments regarding trade negotiations between the UK and EU (which also may keep data subdued until there are agreements). Although one data point does not make a trend, don’t be surprised to see spikes in GBP if data such as this continues to impress.
Latest market news



The complete CFD trading experience
Award-winning platforms, competitive spreads, low commissions and dedicated support.
We live and breathe the markets and are dedicated to helping traders realise their ambitions as we continue to set the industry bar.
Economic calendar
Web Trader platform
Our sophisticated web-based platform is packed with features.
Related articles
EUR/USD Q4 2026 Outlook: Euro at a Crossroads as Fed, ECB Tighten 9 25 2026
EUR/USD enters Q4 at a pivotal inflection point as competing Fed-ECB policy paths and persistent inflation risks collide with major technical support.


USD/JPY Q4 2026 Outlook: Hawkish Fed Pricing Clashes With Intervention Risk
The year-end tug-of-war is clear: hawkish Fed pricing supports USD/JPY, while intervention risk limits the upside.


Japanese Yen Forecast: USD/JPY 4% Rally Challenges Post-Intervention Downtrend 9 24 2026
USD/JPY momentum has shifted sharply higher, putting a major resistance confluence in focus as U.S. and Japanese event risk builds.
StoneX Europe Ltd may make third party material available on this website which may contain information included but not limited to the conditions of financial markets. The material is for information purposes only and does not contain, and should not be construed as containing, investment advice and/or investment recommendation and/or an investment research and/or an offer of or solicitation for any transactions in financial instruments; any decision to enter into a specific transaction shall be made by the client following an assessment by him/her of their situation.
StoneX Europe Ltd makes no representation or warranty and assumes no liability as to the accuracy or completeness of the information provided, nor any loss arising from any investment based on a recommendation, forecast or other information supplied. You should always seek independent advice as to your suitability to speculate in any related markets and your ability to assume the associated risks, if you are at all unsure. We are not under any obligation to update any such material. Any opinion made may be personal to the author and may not reflect the opinion of StoneX Europe Ltd.