



US Dollar flags commodity currencies; AUD/USD and NZD/USD
What happens when you combine a stronger dollar with weaker Gold? Weaker commodity currencies
Share this:

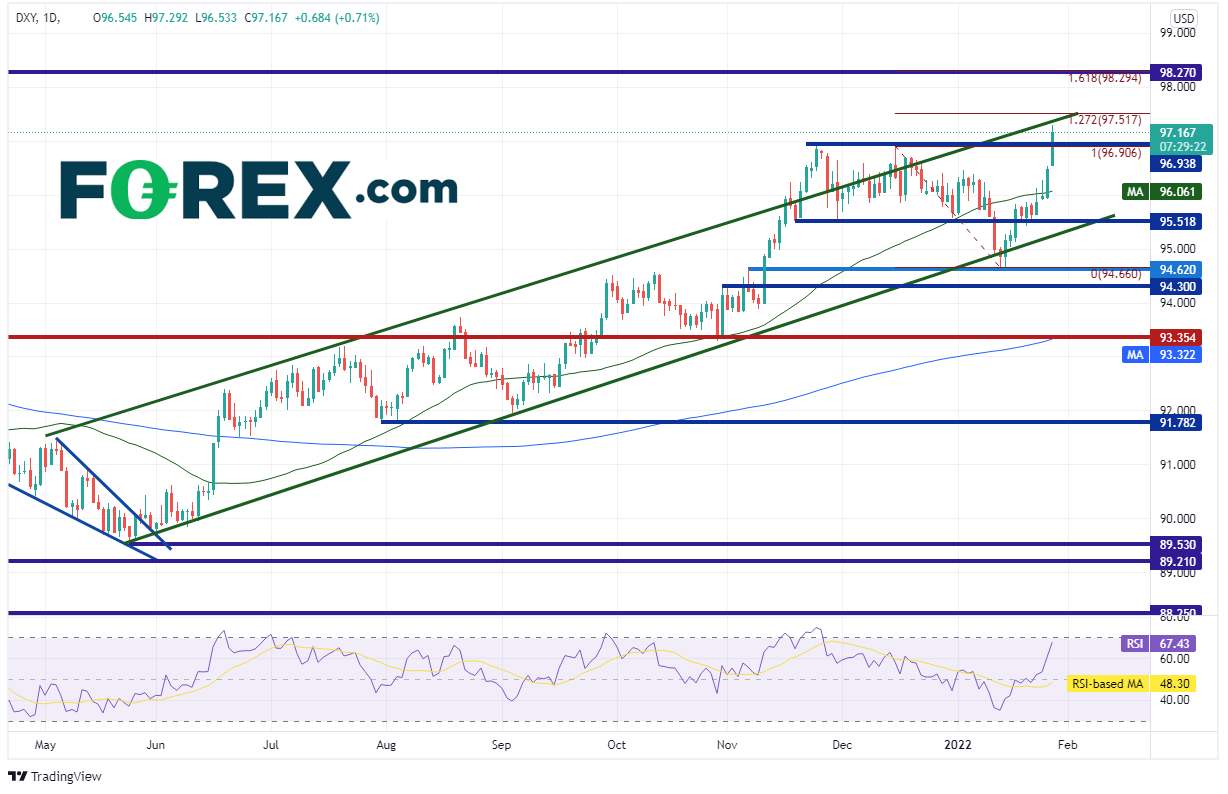
The FOMC statement was mundane to say the least. However, Fed Chairman Powell provided some fireworks in the press conference that followed. As it became more and more clear during the press conference that the only thing the Fed was concerned about was inflation spiraling out of control, the US Dollar (DXY) went bid. And after the GDP data release today, it US Dollar hasn’t looked back.
Source: Tradingview, Stone X
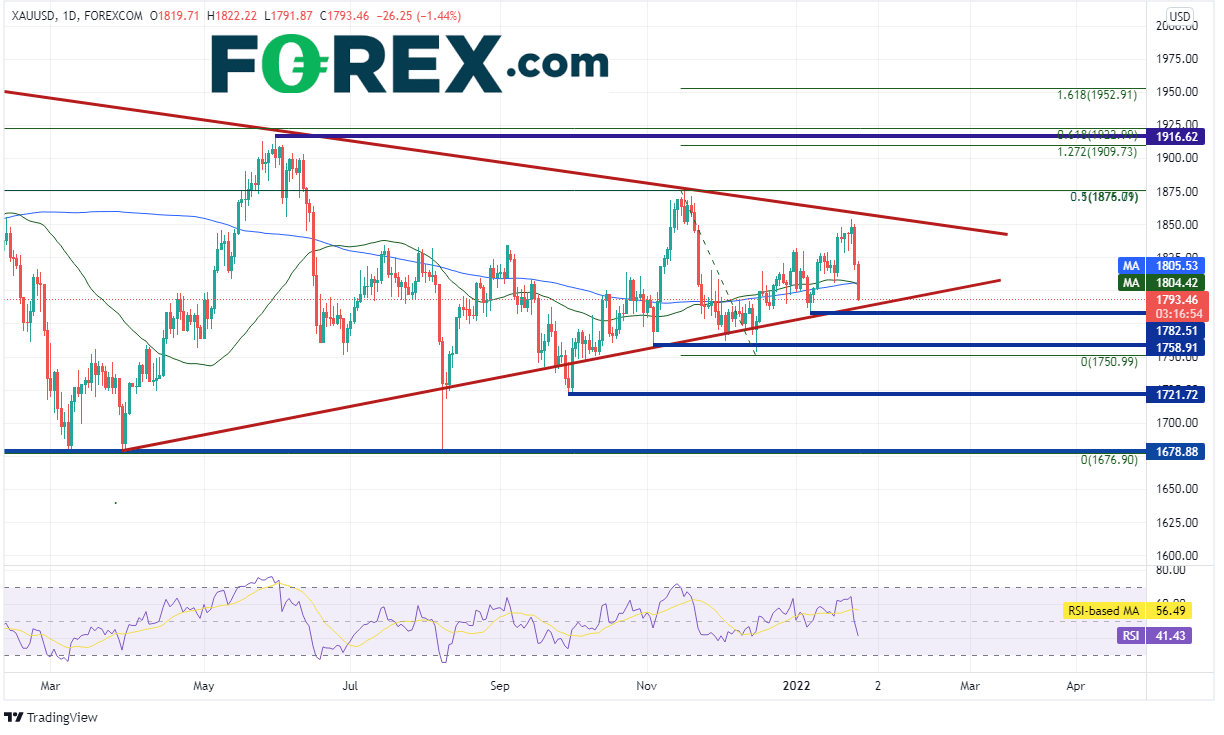
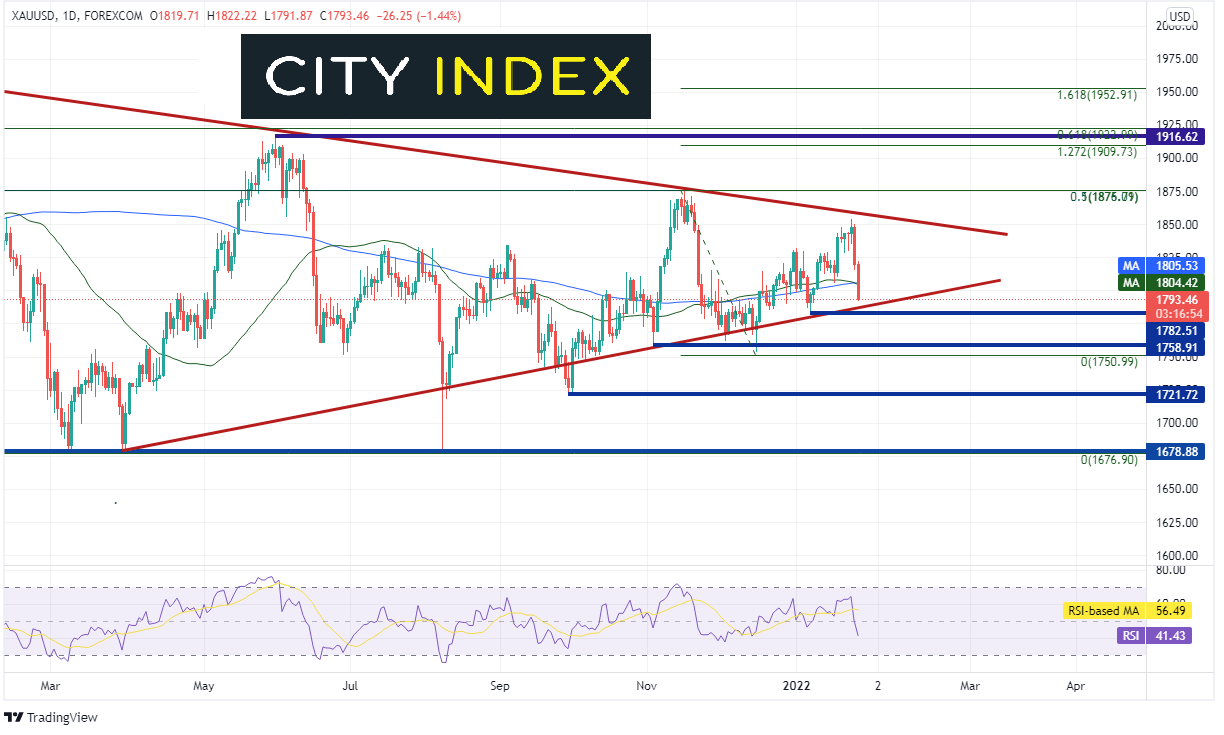
As a result of the strong US Dollar, Gold (XAU/USD) has been moving lower from recent highs on January 24th at 1853.88 down to current levels near the bottom, upward sloping trendline at 1785. There is also horizontal support at 1782.50.
Source: Tradingview, Stone X
Q: What happens when you combine a stronger dollar with weaker Gold?
A: Weaker commodity currencies
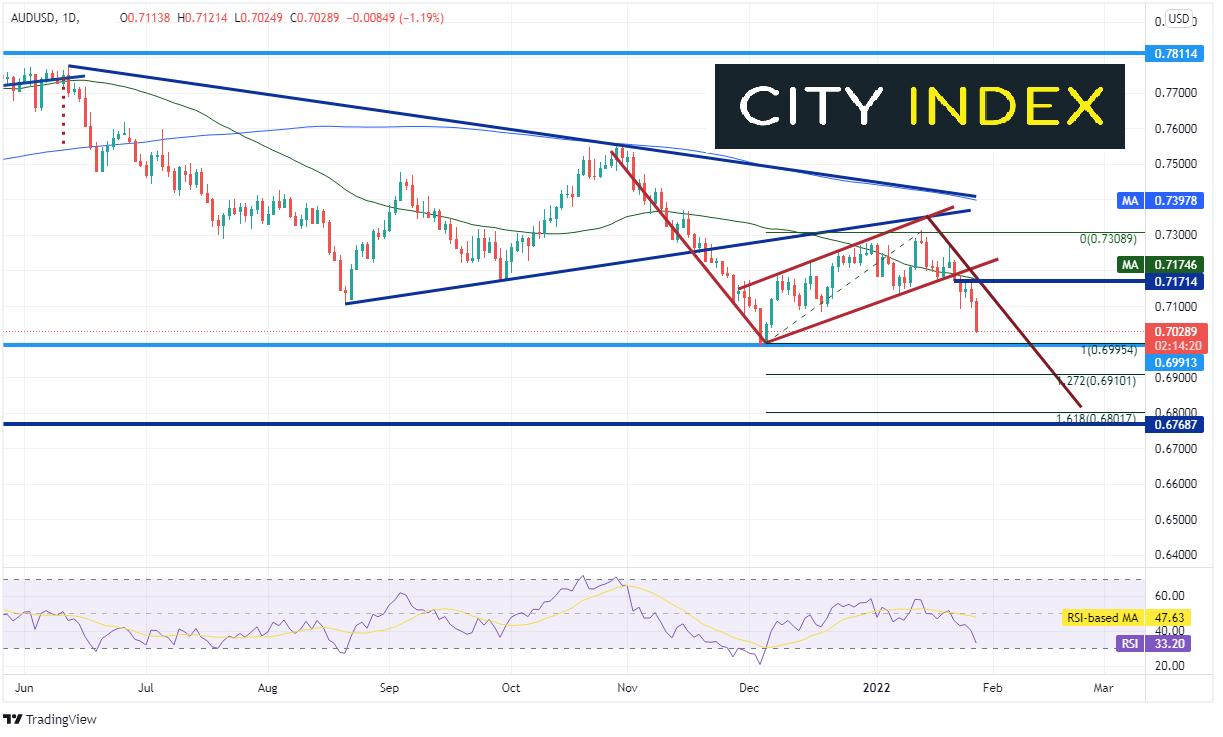
AUD/USD had been consolidating within a long-term symmetrical triangle since June 2021 and finally broke lower on November 19th, 2021. The pair continued to trade lower to prior support of 0.7000 and bounced to retest the bottom trendline of the triangle near 0.7309. In doing so, a flag pattern was formed. On January 21st price broke lower from the flag and below the 50 Day Moving Average at 0.7150. The target for the flag is near 0.6800. However, if AUD/USD is to get there, it must first pass through the December 3rd, 2021 lows at 0.6995 and the 127.2% Fibonacci extension from the December 3rd, 2021 lows to the January 13th highs near 0.6910. Resistance is at Thursday’s highs of 0.7121, then the 50 Day Moving Average and horizontal resistance near 0.7171/0.7175. Note: the RBA meets next week!

Source: Tradingview, Stone X
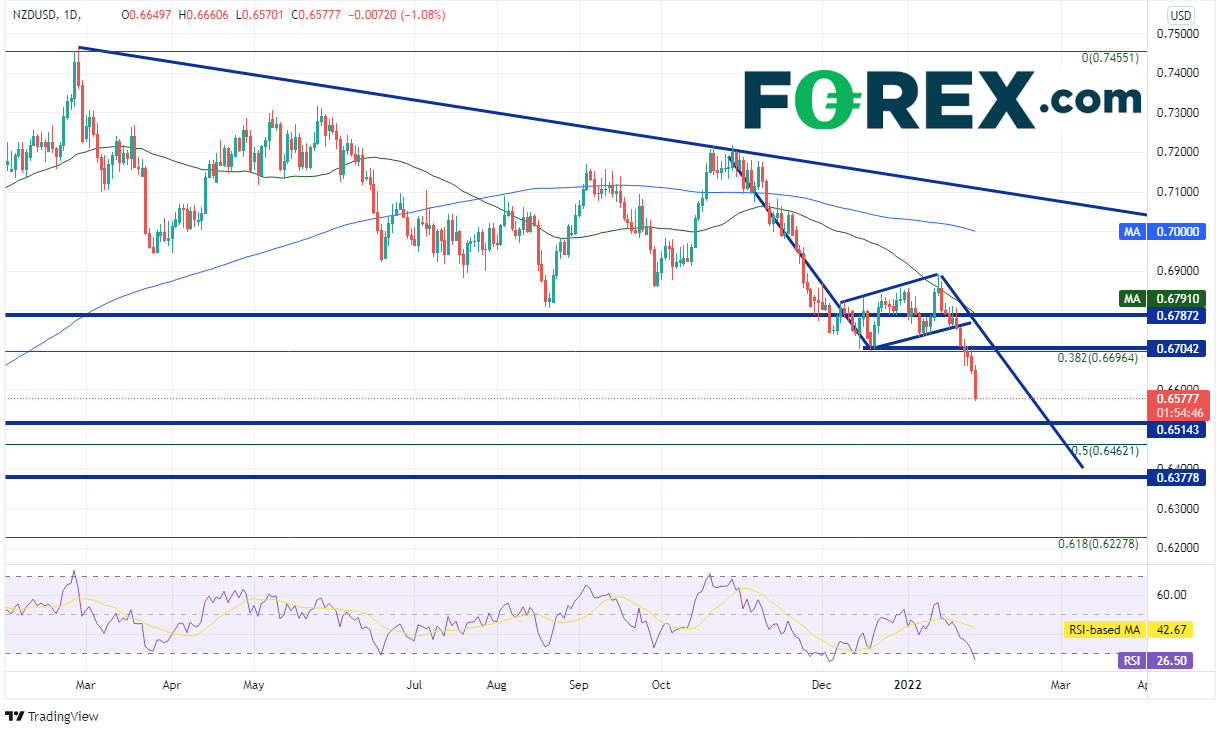
Similarly, NZD/USD had been consolidating within a descending triangle since February 2021. The pair finally broke lower on December 3, 2021 and held support at the 38.2% Fibonacci retracement from the low of March 2020 to the high of February 2021 near 0.6694. NZD/USD then bounced and tried to move back into the triangle, however it was rejected at the 50 Day Moving Average near 0.6890. The pair then broke lower, forming a flag pattern. The target for the flag is near 0.6400. If price is to get to the flag target, it must first break through horizontal support dating back to June 2020 at 0.6514 and the 50% retracement from the recently mentioned timeframe at 0.6462. Resistance is at the recent lows of 0.6704 and a confluence of resistance at the breakdown point of the flag and the 50 Day Moving Average near 0.6971.
Source: Tradingview, Stone X
If inflation data continues to be strong from the US, the Fed will continue to be hawkish and the US Dollar will rise. This will place a drag on Gold and commodity currencies. Watch for bears to sell bounces in AUD/USD and NZD/USD as the pairs and move to their respective flag targets.
The FOMC statement was mundane to say the least. However, Fed Chairman Powell provided some fireworks in the press conference that followed. As it became more and more clear during the press conference that the only thing the Fed was concerned about was inflation spiraling out of control, the US Dollar (DXY) went bid. And after the GDP data release today, it US Dollar hasn’t looked back.

Source: Tradingview, Stone X
Everything you need to know about the Federal Reserve
As a result of the strong US Dollar, Gold (XAU/USD) has been moving lower from recent highs on January 24th at 1853.88 down to current levels near the bottom, upward sloping trendline at 1785. There is also horizontal support at 1782.50.
Source: Tradingview, Stone X
Q: What happens when you combine a stronger dollar with weaker Gold?
A: Weaker commodity currencies
AUD/USD had been consolidating within a long-term symmetrical triangle since June 2021 and finally broke lower on November 19th, 2021. The pair continued to trade lower to prior support of 0.7000 and bounced to retest the bottom trendline of the triangle near 0.7309. In doing so, a flag pattern was formed. On January 21st price broke lower from the flag and below the 50 Day Moving Average at 0.7150. The target for the flag is near 0.6800. However, if AUD/USD is to get there, it must first pass through the December 3rd, 2021 lows at 0.6995 and the 127.2% Fibonacci extension from the December 3rd, 2021 lows to the January 13th highs near 0.6910. Resistance is at Thursday’s highs of 0.7121, then the 50 Day Moving Average and horizontal resistance near 0.7171/0.7175. Note: the RBA meets next week!
Source: Tradingview, Stone X
Trade AUD/USD now: Login or Open a new account!
• Open an account in the UK
• Open an account in Australia
• Open an account in Singapore
Similarly, NZD/USD had been consolidating within a descending triangle since February 2021. The pair finally broke lower on December 3, 2021 and held support at the 38.2% Fibonacci retracement from the low of March 2020 to the high of February 2021 near 0.6694. NZD/USD then bounced and tried to move back into the triangle, however it was rejected at the 50 Day Moving Average near 0.6890. The pair then broke lower, forming a flag pattern. The target for the flag is near 0.6400. If price is to get to the flag target, it must first break through horizontal support dating back to June 2020 at 0.6514 and the 50% retracement from the recently mentioned timeframe at 0.6462. Resistance is at the recent lows of 0.6704 and a confluence of resistance at the breakdown point of the flag and the 50 Day Moving Average near 0.6971.

Source: Tradingview, Stone X
Trade NZD/USD now: Login or Open a new account!
• Open an account in the UK
• Open an account in Australia
• Open an account in Singapore
If inflation data continues to be strong from the US, the Fed will continue to be hawkish and the US Dollar will rise. This will place a drag on Gold and commodity currencies. Watch for bears to sell bounces in AUD/USD and NZD/USD as the pairs and move to their respective flag targets.
Learn more about forex trading opportunities.
Related tags:
Latest market news




The complete CFD trading experience
Award-winning platforms, competitive spreads, low commissions and dedicated support.
We live and breathe the markets and are dedicated to helping traders realise their ambitions as we continue to set the industry bar.
Economic calendar
Web Trader platform
Our sophisticated web-based platform is packed with features.
Related articles
EUR/USD weekly outlook: Oil, inflation and NFP in focus
After coming under significant pressure in recent weeks, the EUR/USD came off its lows to finish the week on a positive note on Friday, albeit with only a mild rebound. That was not enough to prevent the exchange rate falling for the third consecutive week, as the US dollar and bond yields rallied across the board.

Gold Price Forecast: XAU/USD Avoids Breakdown as Yields Surged but Can it Continue?
Surging Treasury yields sent a jolt across markets last week but, so far, gold prices have held above the FOMC low. The big question now is whether that can continue and, if not, will bulls show up at $4100 or $4k like they did in June and July?


USD/JPY Weekly Outlook: Payrolls loom as US rates remain the dominant driver
Strong US growth and hawkish Fed pricing continue to support USD/JPY, while intervention risk appears to be kicking in at lower levels

StoneX Europe Ltd may make third party material available on this website which may contain information included but not limited to the conditions of financial markets. The material is for information purposes only and does not contain, and should not be construed as containing, investment advice and/or investment recommendation and/or an investment research and/or an offer of or solicitation for any transactions in financial instruments; any decision to enter into a specific transaction shall be made by the client following an assessment by him/her of their situation.
StoneX Europe Ltd makes no representation or warranty and assumes no liability as to the accuracy or completeness of the information provided, nor any loss arising from any investment based on a recommendation, forecast or other information supplied. You should always seek independent advice as to your suitability to speculate in any related markets and your ability to assume the associated risks, if you are at all unsure. We are not under any obligation to update any such material. Any opinion made may be personal to the author and may not reflect the opinion of StoneX Europe Ltd.