








USD/JPY: Bearish Signals Mount as Japan Core Inflation Surprises Again
Japan’s sticky core inflation and surging bond yields are fuelling expectations the BoJ may hike rates again, sending a warning to USD/JPY bulls. As technicals turn bearish, are markets underestimating the yen’s comeback?
Share this:

- Japan inflation ex-energy, fresh food accelerates to 3.0% YY
- Swaps price 76% chance of 25bp BoJ hike by year-end
- JGB yields rising, pressuring long-end rates globally
- USD/JPY correlation with Japanese yields strengthens
- Technicals point to more downside—144.00 remains key resistance
Summary
Core inflation in Japan continues to run hot, keeping pressure on the BoJ to tighten policy again despite growing global risks. This analysis breaks down why swaps are ramping up rate hike expectations, how long-end Japanese yields are reshaping USD/JPY drivers, and why the technical setup now favours further downside in the pair.
Japan Inflation Heating Up
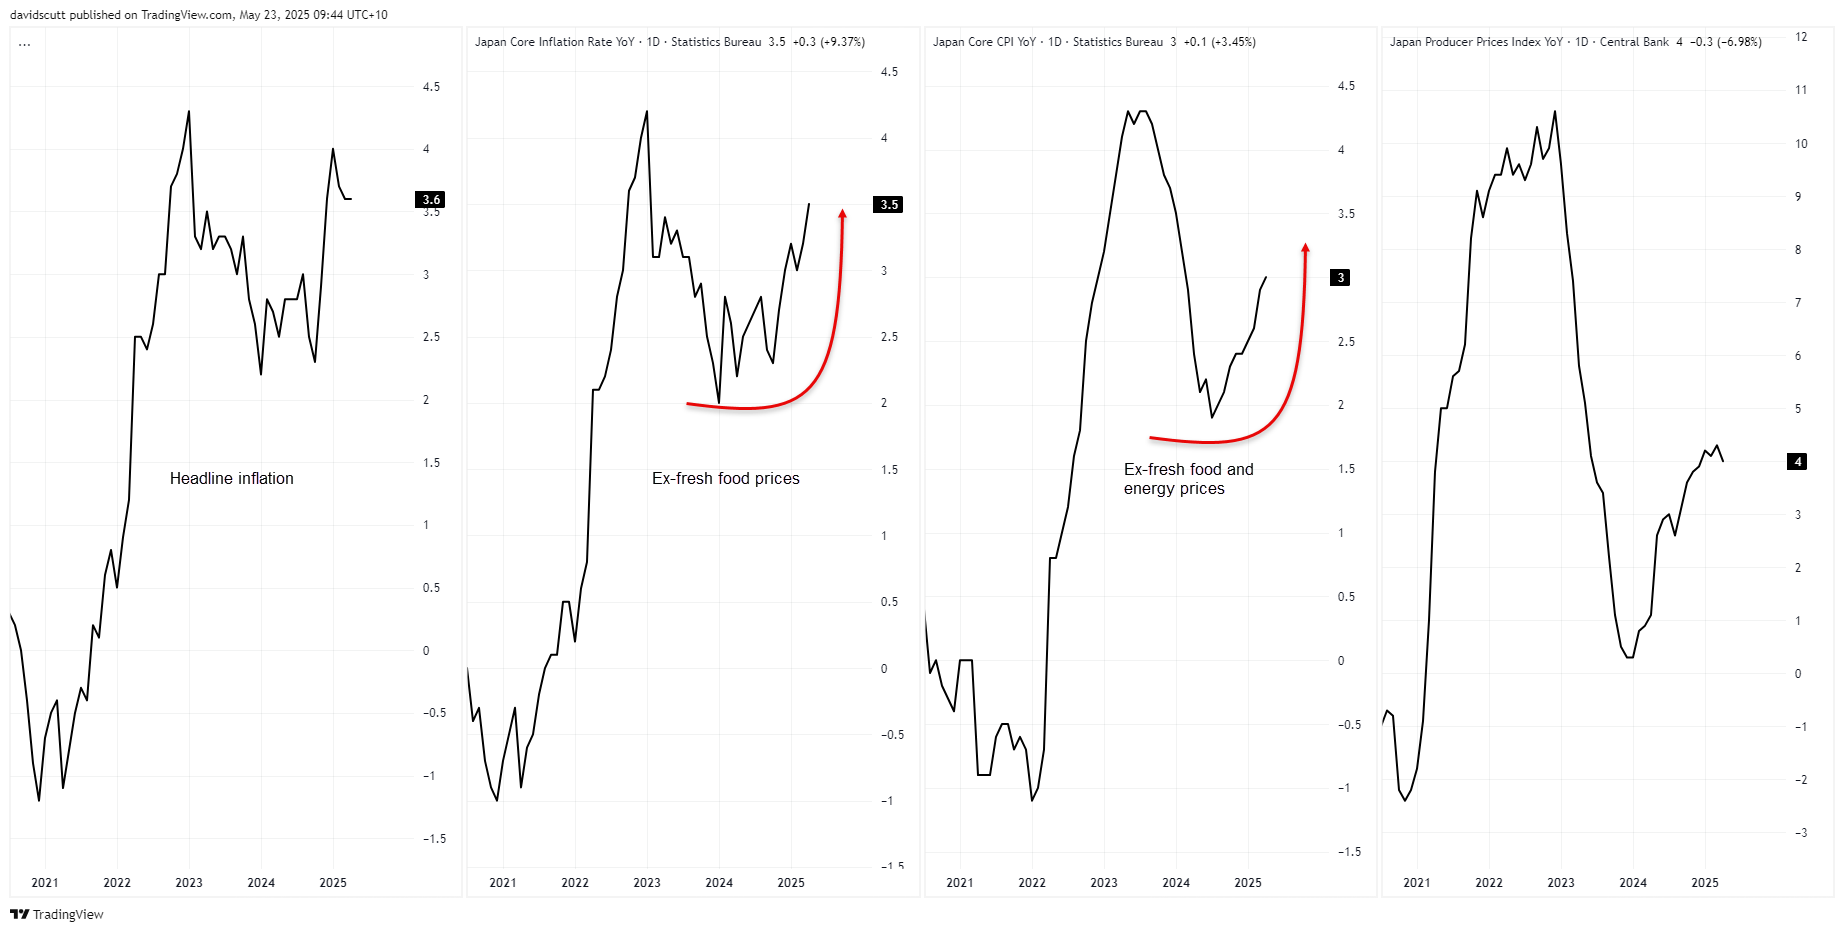
Japan’s core inflation measures are showing no signs of cooling, reinforcing expectations the BOJ may lift interest rates again soon despite risks posed by rapidly shifting U.S. trade policy.
Source: TradingView
April inflation excluding fresh food jumped 3.5% from a year earlier, the fastest pace in over two years and above the 3.4% forecast. More importantly for BOJ policy, the core-core gauge—which excludes fresh food and energy items—rose 3.0% over the year, up from 2.9% in March. That’s well above the BOJ’s 2% target and tracking stronger than the bank’s FY25 forecast of 2.3%.
Next Friday, markets will receive inflation data from Tokyo for May, providing clues on what may be seen nationwide when the figures are released in late June. Put that in the calendar!
Source: TradingView
BOJ Rate Hikes Return on Horizon
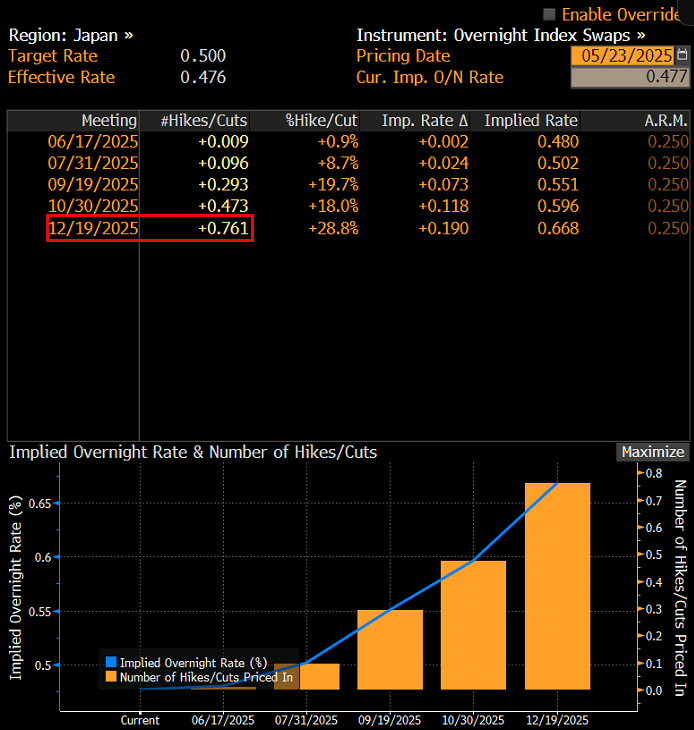
Markets are taking note of underlying inflation trends, with swaps pricing in a 76% chance of a 25bp hike by year-end—a noticeable turnaround from a month ago when such a move was deemed remote at best.
Source: Bloomberg
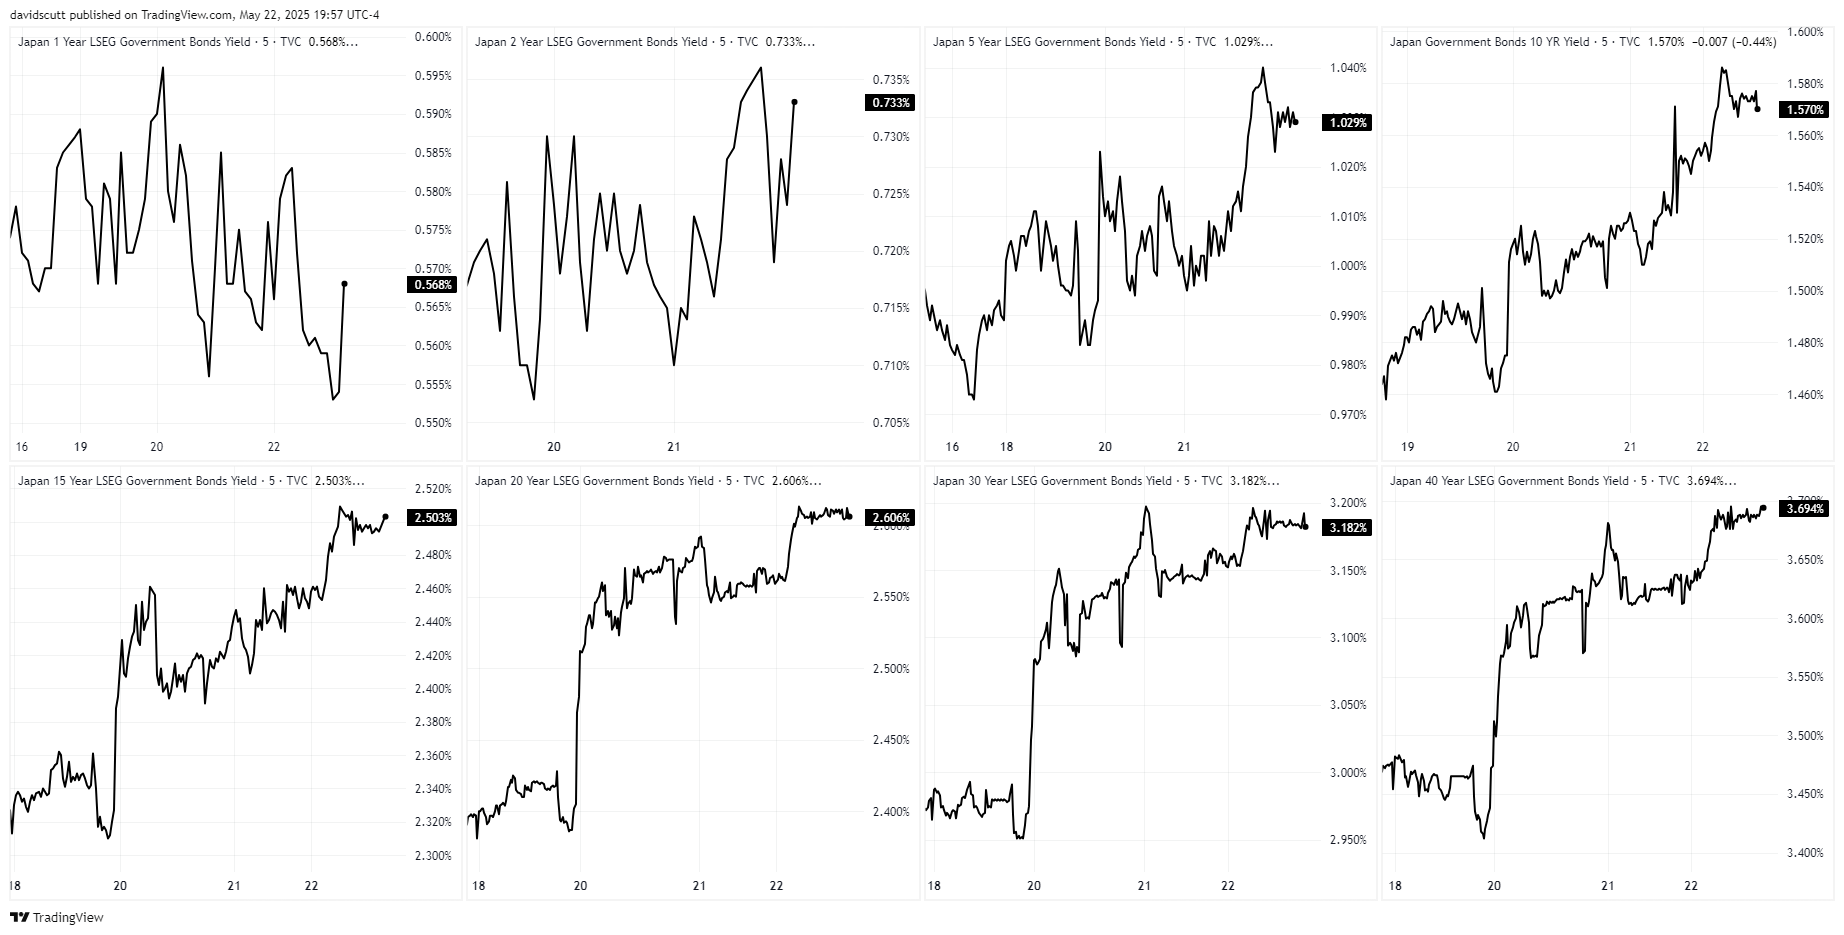
The persistent inflation backdrop—highly unusual for Japan after battling decades of deflation—has contributed to a steep rise in Japanese government bond yields this year, especially for longer-dated securities. That’s pressured long bonds in other nations too, as Japanese investors are tempted to invest domestically rather than abroad, especially with yield differentials narrowing aggressively.
Source: TradingView
Higher Japan Yields Cool Carry Trades?
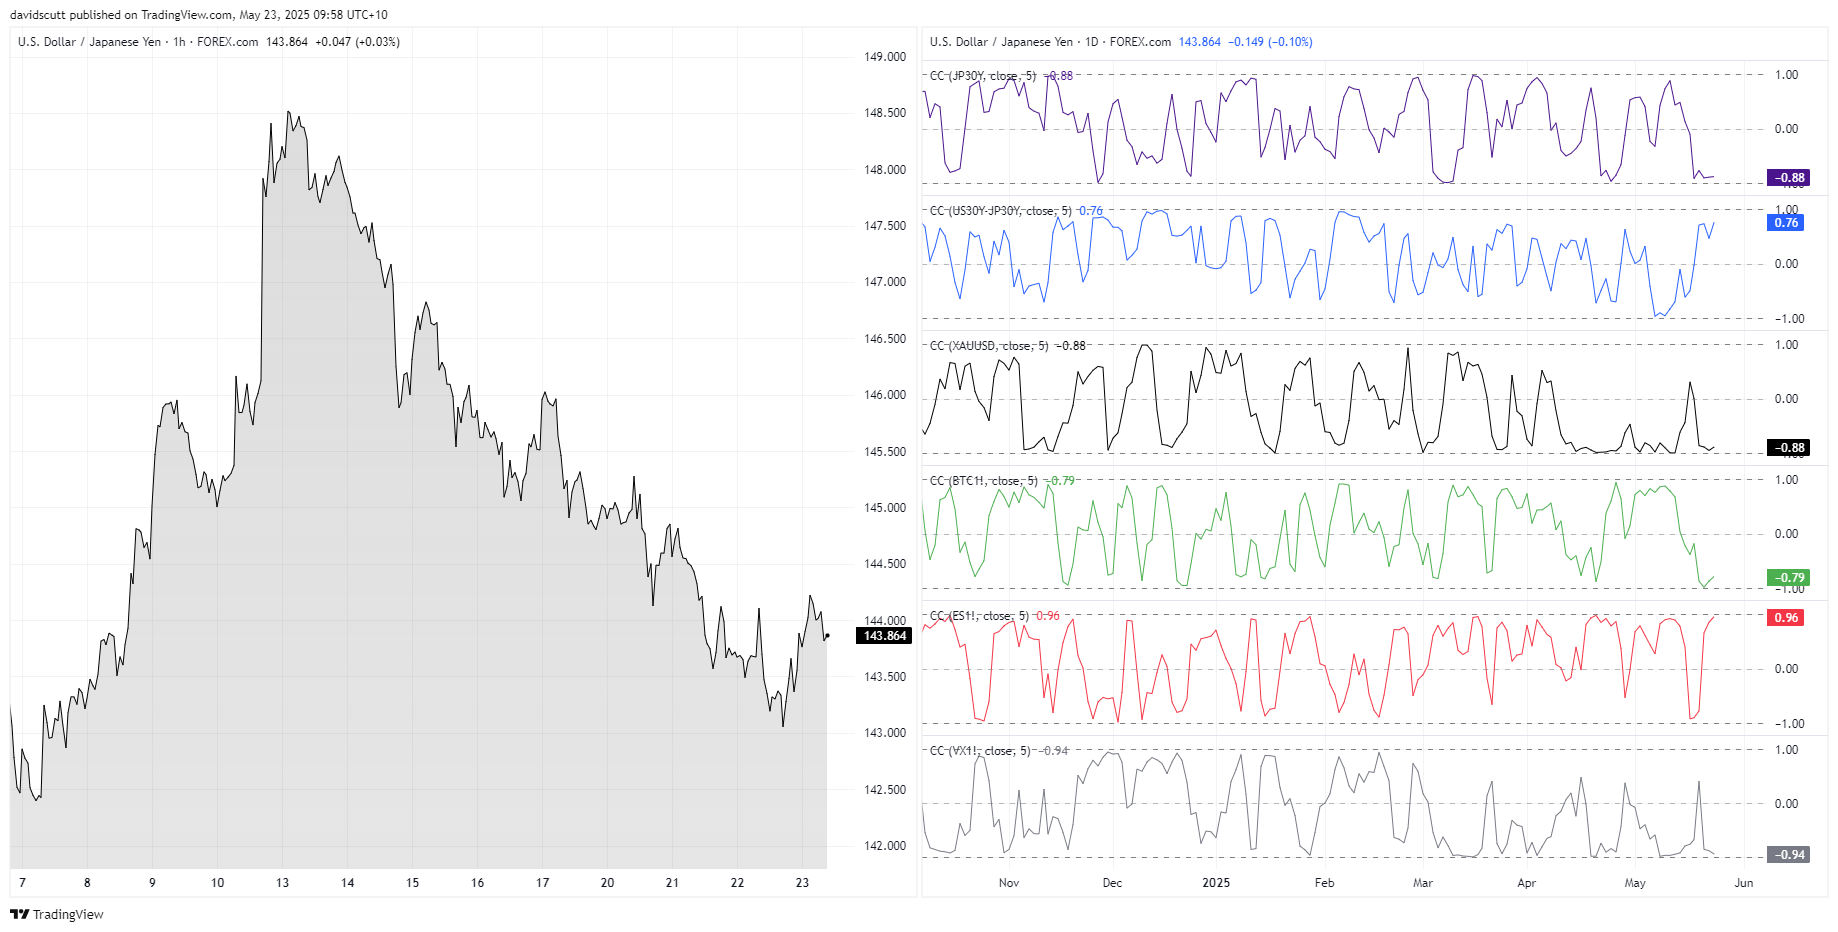
What’s noticeable over the past week is the strong inverse correlation between USD/JPY and moves in Japanese 30-year bond yields, indicated by the purple line below, sitting at -0.88. Historically, USD/JPY has often been tied at the hip with U.S. Treasury yields, but that relationship has vanished in recent months. Instead, moves in Japanese yields have become increasingly important, as shown by the strengthening positive correlation with U.S.–Japan 30-year yield spreads over the same period.
Source: TradingView
While USD/JPY has also been strongly correlated with traditional drivers like S&P 500 (red) futures and VIX (grey), and inversely correlated with safe havens such as gold (black), that likely reflects that investors in other asset classes are also watching long bond yields like a hawk.
USD/JPY: Selling Rallies Preferred
Source: TradingView
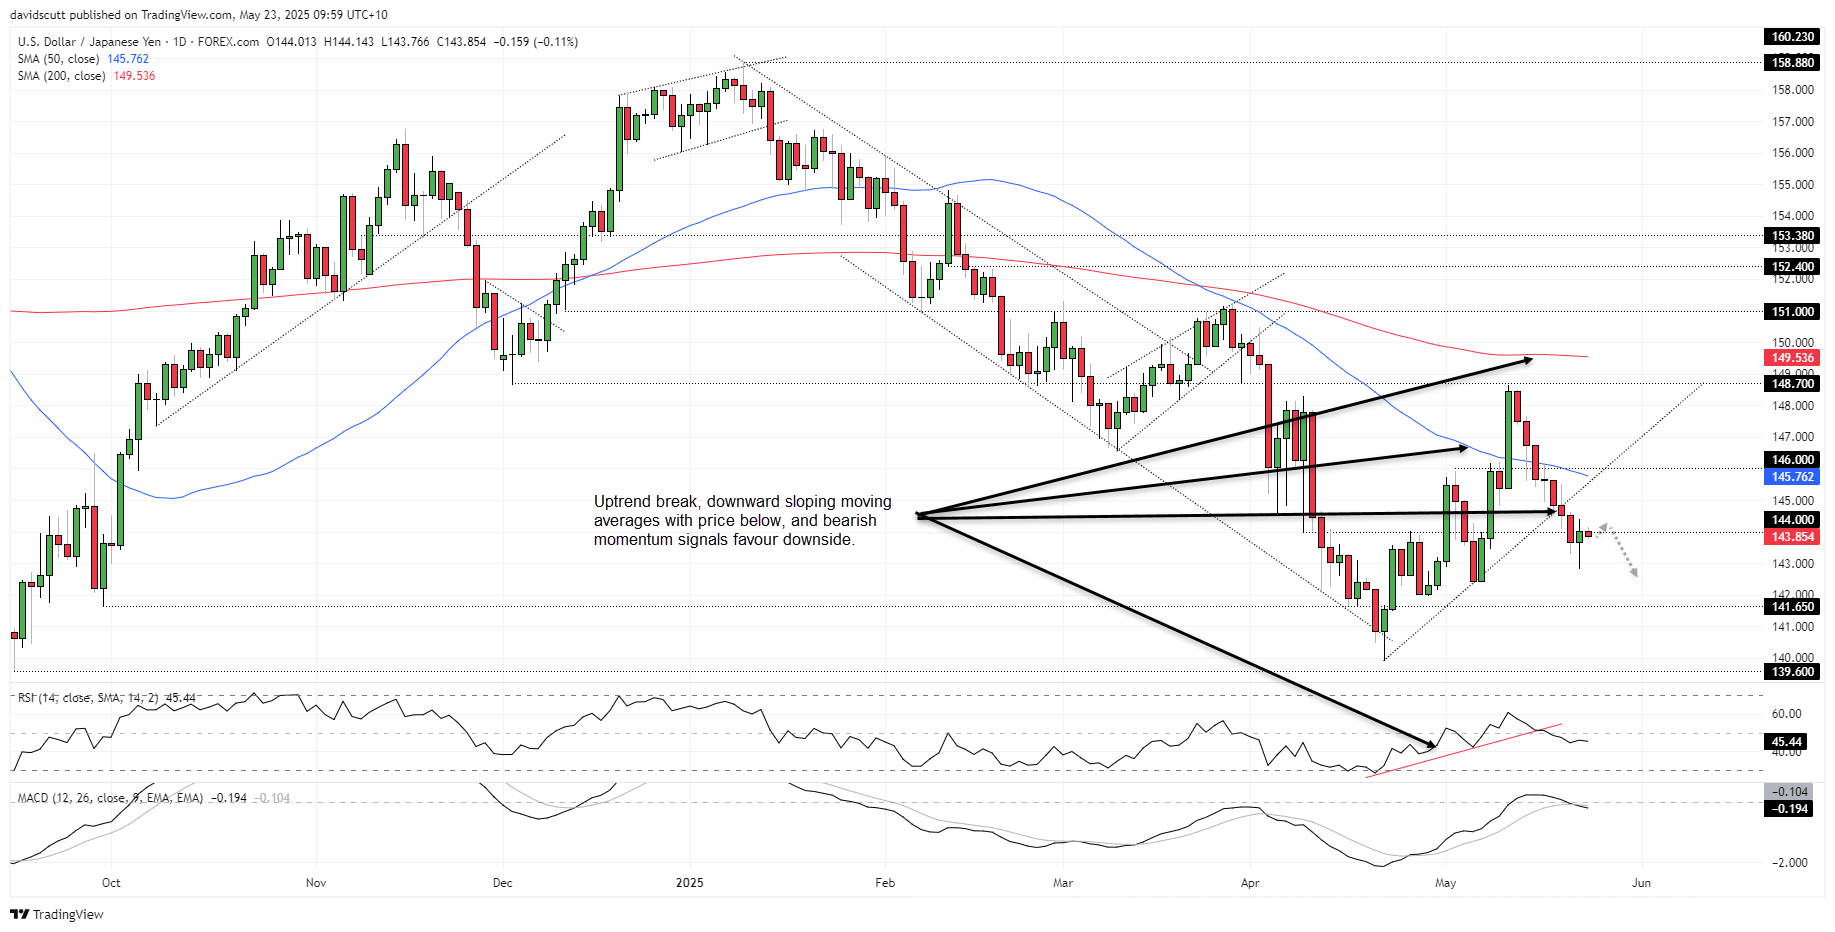
Technicals also favour yen strength against the U.S. dollar near-term, with price and momentum signals combining with moving averages to deliver a backdrop that points to continued downside.
The break of the April 22 uptrend shifted directional risks lower earlier this week, likely prompting fresh shorts and contributing to the unwind to 142.80 before bottoming. Despite the bounce above 144.00 on Thursday, like other recent probes above this level, it failed to stick, with the pair reversing back below early in the Asian session.
With RSI (14) trending lower and below 50, and MACD crossing the signal line from above in negative territory, momentum is turning bearish, favouring downside over upside. With both the 50- and 200-day moving averages sloping downward, selling rallies and downside breaks remains the preferred strategy.
Pushes above 144.00 have been met with renewed selling pressure, making that a level for bears to consider establishing shorts. Beyond 142.80, 142.50 and 142 may see buyers emerge, although more pronounced support is found at 141.65.
If USD/JPY were to close above Thursday’s high, it would shift the bias to neutral on a short-term basis.
-- Written by David Scutt
Follow David on Twitter @scutty
How to trade with City Index
You can trade with City Index by following these four easy steps:
- Open an account, or log in if you’re already a customer
• Open an account in the UK
• Open an account in Australia
• Open an account in Singapore
- Search for the market you want to trade in our award-winning platform
- Choose your position and size, and your stop and limit levels
- Place the trade
Related tags:

The complete CFD trading experience
Award-winning platforms, competitive spreads, low commissions and dedicated support.
We live and breathe the markets and are dedicated to helping traders realise their ambitions as we continue to set the industry bar.
Economic calendar
Web Trader platform
Our sophisticated web-based platform is packed with features.
Related articles

Blue wave adds to Nikkei’s AI troubles
The Nikkei 225 has taken another beating as a Democratic sweep adds to concerns about AI investment returns. But after the scale of the earlier declines, how much bad news is already priced in?

US dollar outlook: Nasdaq breakdown raises stakes for EUR/USD, USD/JPY
A potential Democratic sweep of Congress is adding to the AI trade's headaches, with Nasdaq 100 futures breaking below a major technical level. The implications for the dollar could be significant.

US Dollar Short-term Outlook: USD Rally on the Line as Midterms, NFP Loom 11 3 2026
DXY is testing pivotal support, with the weekly range breakout likely to determine the next major leg of the trend as key event risk unfolds.

StoneX Europe Ltd may make third party material available on this website which may contain information included but not limited to the conditions of financial markets. The material is for information purposes only and does not contain, and should not be construed as containing, investment advice and/or investment recommendation and/or an investment research and/or an offer of or solicitation for any transactions in financial instruments; any decision to enter into a specific transaction shall be made by the client following an assessment by him/her of their situation.
StoneX Europe Ltd makes no representation or warranty and assumes no liability as to the accuracy or completeness of the information provided, nor any loss arising from any investment based on a recommendation, forecast or other information supplied. You should always seek independent advice as to your suitability to speculate in any related markets and your ability to assume the associated risks, if you are at all unsure. We are not under any obligation to update any such material. Any opinion made may be personal to the author and may not reflect the opinion of StoneX Europe Ltd.