





USD/JPY forecast: 151 seems plausible, 152 may be a stretch
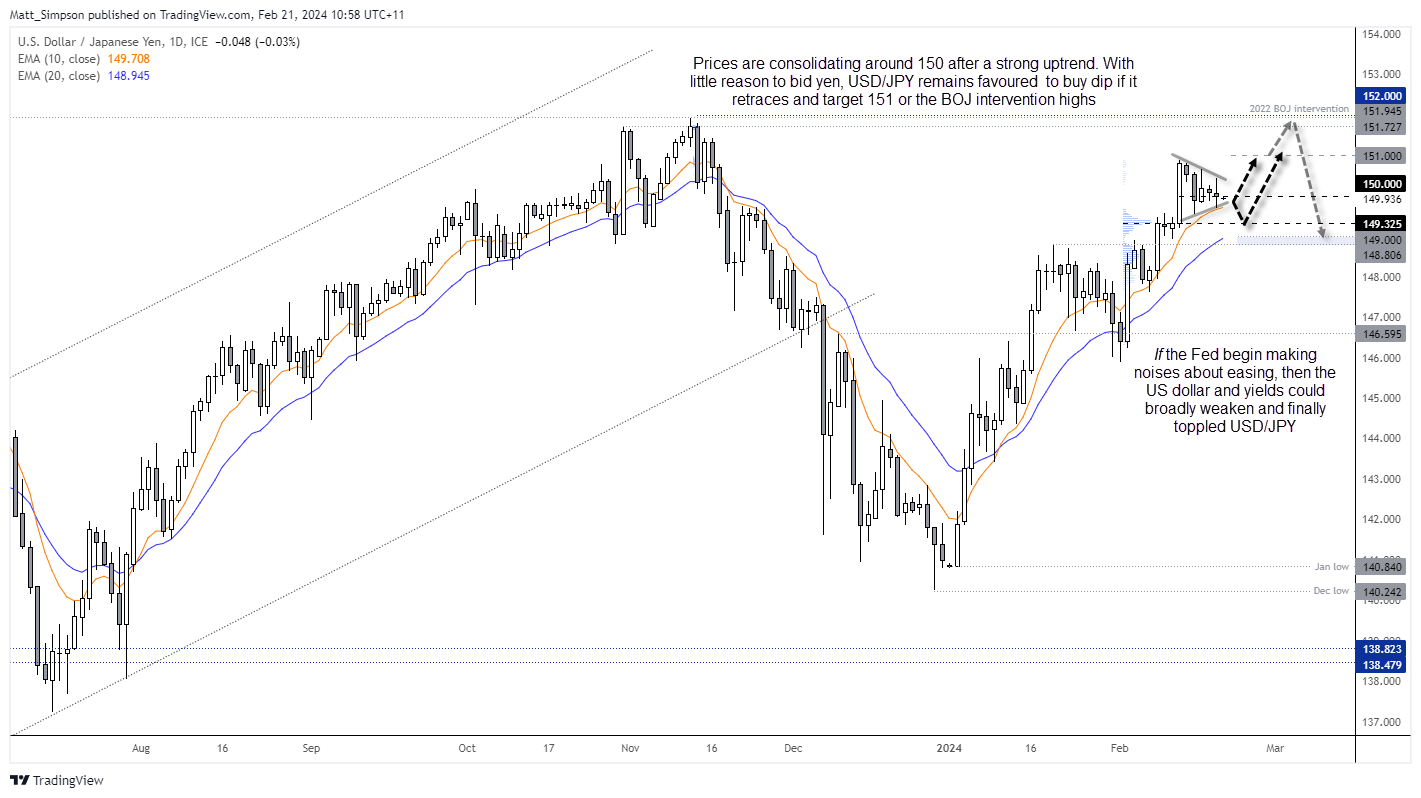
USD/JPY is clinging to 150 despite the weaker US dollar on Tuesday, as there seems little reason for traders to bid the yen. And unless we receive a compelling reason to buy then yen via a surprisingly hawkish BOJ or broad risk-off environment, it becomes difficult to construct an overly bearish case for USD/JPY whilst the Fed remain quiet about rate cuts.
Share this:

USD/JPY is clinging to 150 despite the weaker US dollar on Tuesday, as there seems little reason for traders to bid the yen. And unless we receive a compelling reason to buy then yen via a surprisingly hawkish BOJ or broad risk-off environment, it becomes difficult to construct an overly bearish case for USD/JPY whilst the Fed remain quiet about rate cuts.
Yen futures large speculator positioning – COT report
With that said, I did outline in the weekly COT report that bearish bets against yen futures bears are near a sentiment extreme. And that does run the risk of yen futures holding above their 2023 lows, which equates to USD/JPY failing to break above its 2023 highs. Yet patience is required as this is on the weekly charts. And it doesn’t mean that USD/JPY can’t perform another leg higher towards 152 before we see a decent retracement. For now, USD/JPY remains in the ‘buy the dip’ category, given its strong trend.
USD/JPY technical analysis (daily chart)
Technically, the USD/JPY trend remains firmly bullish on the daily chart. Prices are consolidating around 150 and holding above the 10-day EMA, and a ‘spinning top’ doji formed on Tuesday to show indecision around current levels. Traders should be on guard for spikes in either direction before the ‘real move’ unfolds. But due to its dominant bullish trend, the bias remains bullish and to seek bullish setups around support levels if prices retrace lower – as a rise to 151 at a minimum seems plausible.
Note potential support levels to seek bullish setups:
- 149.72 (10-day EMA)
- 149.30 (volume cluster)
- 148.95 – 149 (20-day EMA, round number)
USD/JPY technical analysis (4-hour chart)
The 4-hour chart shows that USD/JPY is trading within a similar pattern to the retracement seen at the later stages of January. Note that the EMAs are fanning out in the correct bullish sequence, and retracements have been shallow during its strong bullish trend. Perhaps we'll see a dip lower at the Tokyo open, but I'd prefer to seek dips than short personally. Ultimately, USD/JPY is preferred on a 'buy the dip' basis. But the closer we get to the BOJ intervention highs / 152, the greater the odds that the market will want to naturally snap back like it did in November.
-- Written by Matt Simpson
Follow Matt on Twitter @cLeverEdge
How to trade with City Index
You can trade with City Index by following these four easy steps:
- Open an account, or log in if you’re already a customer
• Open an account in the UK
• Open an account in Australia
• Open an account in Singapore
- Search for the market you want to trade in our award-winning platform
- Choose your position and size, and your stop and limit levels
- Place the trade
Related tags:
Latest market news




The complete CFD trading experience
Award-winning platforms, competitive spreads, low commissions and dedicated support.
We live and breathe the markets and are dedicated to helping traders realise their ambitions as we continue to set the industry bar.
Economic calendar
Web Trader platform
Our sophisticated web-based platform is packed with features.
Related articles
S&P 500, Nasdaq, Dow Forecast: Wall Street Split Widens Into Month-End 9 26 2026
Nasdaq strength contrasts with mounting Dow pressure as rising Treasury yields raise the stakes for stocks heading into the monthly close.

EUR/USD weekly outlook: Oil, inflation and NFP in focus
After coming under significant pressure in recent weeks, the EUR/USD came off its lows to finish the week on a positive note on Friday, albeit with only a mild rebound. That was not enough to prevent the exchange rate falling for the third consecutive week, as the US dollar and bond yields rallied across the board.

Gold Q4 2026 outlook: Resilience in the face of rallying dollar and yields
As we headed towards the latter stages of Q3 and into Q4, the Fed had just hiked rates in a hawkish FOMC meeting, while the likes of the ECB and BoJ had also tightened their respective policies. Oil prices remained elevated amid the prolonged US-Iran conflict. Meanwhile, bond yields were breaking out, and the dollar was higher across the board. Yet, remarkably, gold was still holding in the positive territory for the third quarter, even if it had weakened somewhat in September.
StoneX Europe Ltd may make third party material available on this website which may contain information included but not limited to the conditions of financial markets. The material is for information purposes only and does not contain, and should not be construed as containing, investment advice and/or investment recommendation and/or an investment research and/or an offer of or solicitation for any transactions in financial instruments; any decision to enter into a specific transaction shall be made by the client following an assessment by him/her of their situation.
StoneX Europe Ltd makes no representation or warranty and assumes no liability as to the accuracy or completeness of the information provided, nor any loss arising from any investment based on a recommendation, forecast or other information supplied. You should always seek independent advice as to your suitability to speculate in any related markets and your ability to assume the associated risks, if you are at all unsure. We are not under any obligation to update any such material. Any opinion made may be personal to the author and may not reflect the opinion of StoneX Europe Ltd.