




USDCAD and WTI Correlation Unreliable Macklem in as new BOC Governor
Many times, USD/CAD has been discussed in the context of its relationship with Crude Oil.
Share this:

Many times, USD/CAD has been discussed in the context of its relationship with Crude Oil. We are no exception; as many times we write how a move in USD/CAD can be attributed to a move in WTI Crude Oil. The Canadian Dollar is often positively correlated with WTI; therefore the 2 assets move together (USD/CAD and WTI move opposite each other). However, with the latest bout of volatility in oil, USD/CAD managed to maintain its composure, despite decoupling from its connection with WTI.
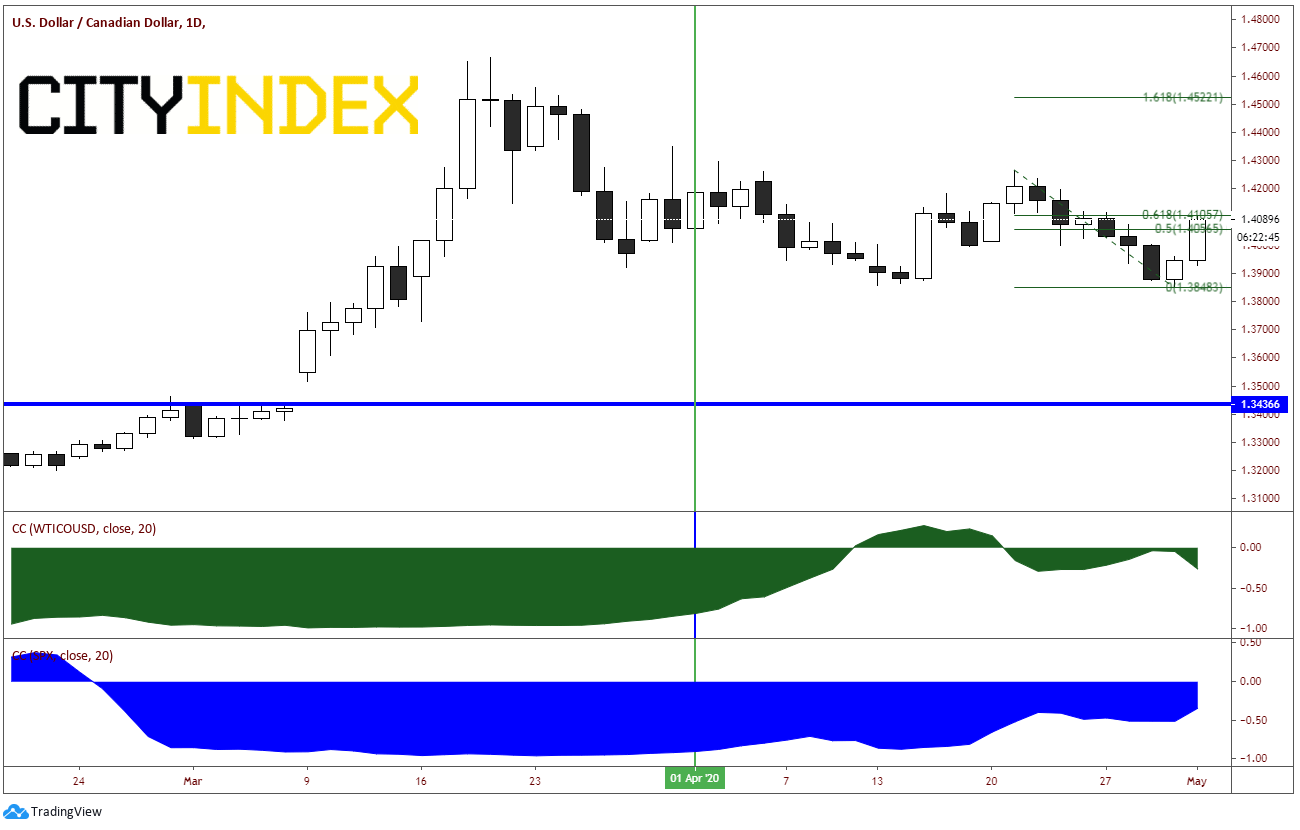
Notice the green correlation coefficient indicator on the bottom of the chart below. Since April 1st, USD/CAD had been slowly moving from a strong negative correlation with WTI (near -.80) to a positive neutral/position correlation by mid-month as crude continued its unprecedented decline. Towards late April, the correlation turned negative, however it remains close to neutral.
Source: Tradingview, City Index
Now look at the blue correlation coefficient indicator also on the bottom of the chart above. This is the correlation between USD/CAD and the S&P 500. Since April 1st, USD/CAD also had a strong negative correlation to the S&P 500 (near -0.90). However, with Crude selling off and the S&P 500 moving higher, the correlation coefficient between USD/CAD and the S&P 500 has remained negative (although less negative than on April 1st).
What does this mean? This means that until USD/CAD and WTI can recouple, moves in crude oil should not be relied on as heavily as one may have done in the past. If one is looking for direction in the USD/CAD, it may be better to look at the S&P 500 as the negative correlation is stronger than that of crude oil.
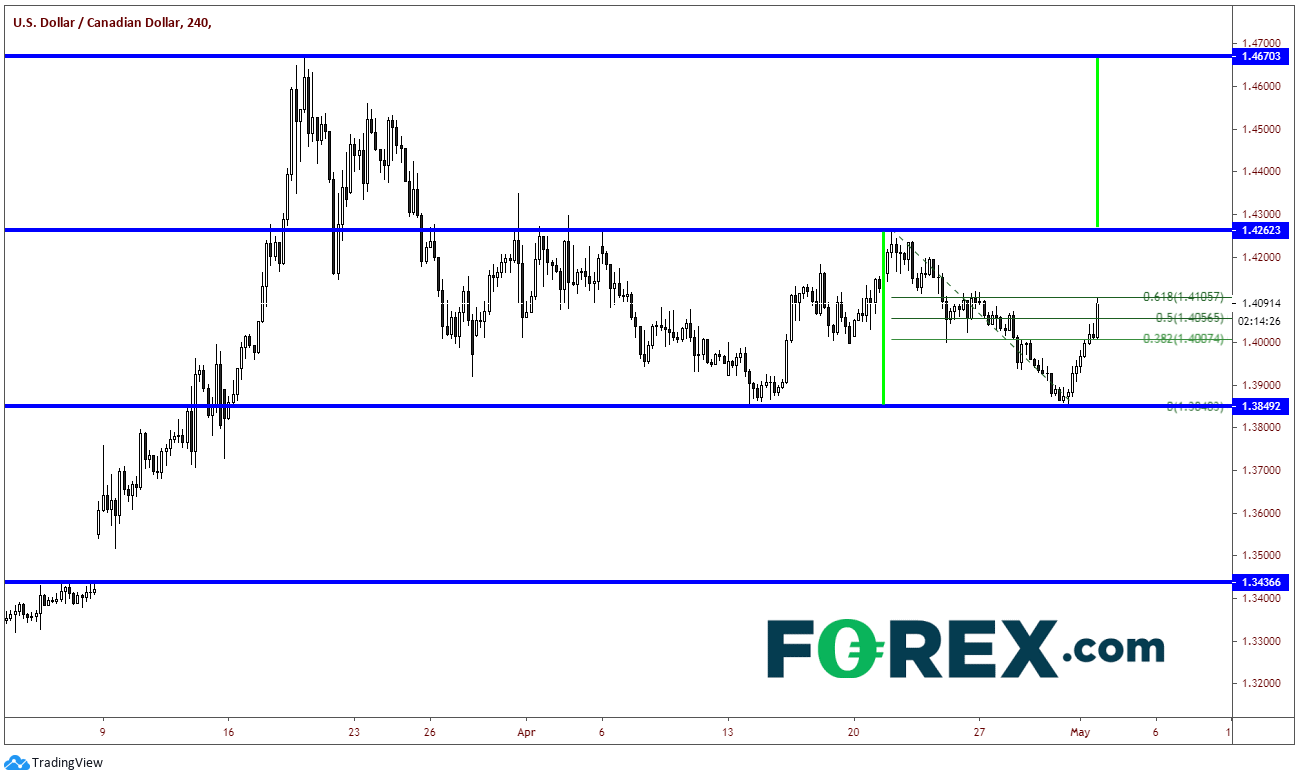
*As a I began writing, Tiff Macklem has just been named new Bank of Canada Governor. He was a previous Deputy Governor from 2010-2014 under Mark Carney. He said, “negative rates are an option” and that “the situation calls for unprecedented response. “ USD/CAD is moving aggressively higher. Price moved from the 38.2% Fibonacci retracement level from the April 21st highs to yesterday ‘s lows near 1.3850 up to the 61.8% Fibonacci retracement level near 1.4105. The pair also has touched the 1.3850 level twice since April 13th, and if the pair breaks above recent highs at 1.4262, it will have formed a double bottom. The target for a double bottom is the distance from the top of the channel to the bottom of the channel added to the breakout level. Therefore, the target would be 1.4670, which is also a few pips shy of the March 19th highs.
Source: Tradingview, City Index
Many times, USD/CAD has been discussed in the context of its relationship with Crude Oil. We are no exception; as many times we write how a move in USD/CAD can be attributed to a move in WTI Crude Oil. The Canadian Dollar is often positively correlated with WTI; therefore the 2 assets move together (USD/CAD and WTI move opposite each other). However, with the latest bout of volatility in oil, USD/CAD managed to maintain its composure, despite decoupling from its connection with WTI.
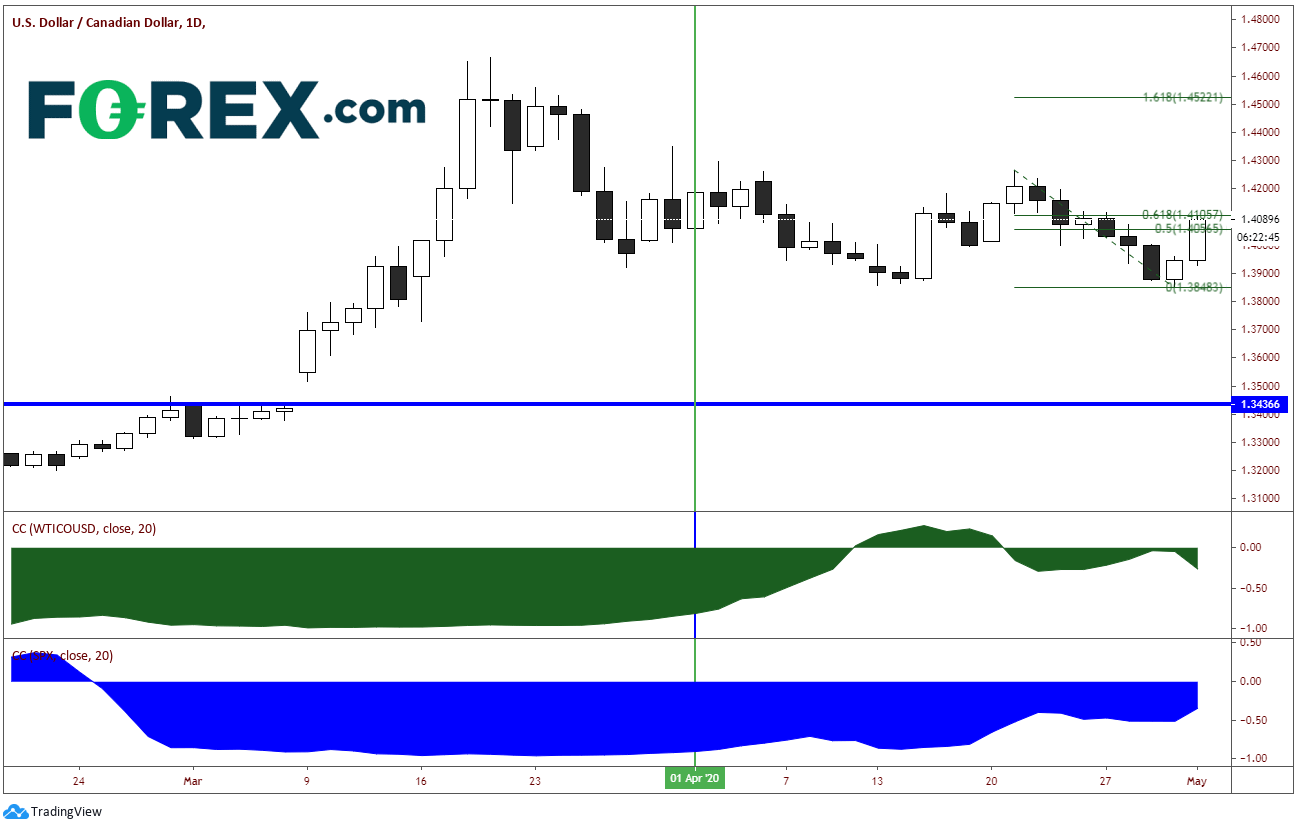
Notice the green correlation coefficient indicator on the bottom of the chart below. Since April 1st, USD/CAD had been slowly moving from a strong negative correlation with WTI (near -.80) to a positive neutral/position correlation by mid-month as crude continued its unprecedented decline. Towards late April, the correlation turned negative, however it remains close to neutral.
Source: Tradingview, FOREX.com
Now look at the blue correlation coefficient indicator also on the bottom of the chart above. This is the correlation between USD/CAD and the S&P 500. Since April 1st, USD/CAD also had a strong negative correlation to the S&P 500 (near -0.90). However, with Crude selling off and the S&P 500 moving higher, the correlation coefficient between USD/CAD and the S&P 500 has remained negative (although less negative than on April 1st).
What does this mean? This means that until USD/CAD and WTI can recouple, moves in crude oil should not be relied on as heavily as one may have done in the past. If one is looking for direction in the USD/CAD, it may be better to look at the S&P 500 as the negative correlation is stronger than that of crude oil.
*As a I began writing, Tiff Macklem has just been named new Bank of Canada Governor. He was a previous Deputy Governor from 2010-2014 under Mark Carney. He said, “negative rates are an option” and that “the situation calls for unprecedented response. “ USD/CAD is moving aggressively higher. Price moved from the 38.2% Fibonacci retracement level from the April 21st highs to yesterday ‘s lows near 1.3850 up to the 61.8% Fibonacci retracement level near 1.4105. The pair also has touched the 1.3850 level twice since April 13th, and if the pair breaks above recent highs at 1.4262, it will have formed a double bottom. The target for a double bottom is the distance from the top of the channel to the bottom of the channel added to the breakout level. Therefore, the target would be 1.4670, which is also a few pips shy of the March 19th highs.
Source: Tradingview, FOREX.com


The complete CFD trading experience
Award-winning platforms, competitive spreads, low commissions and dedicated support.
We live and breathe the markets and are dedicated to helping traders realise their ambitions as we continue to set the industry bar.
Economic calendar
Web Trader platform
Our sophisticated web-based platform is packed with features.
Related articles

Nikkei breakout accelerates as yen weakness returns
Nikkei has started October with a powerful breakout, helped by renewed yen weakness and strong upside momentum


S&P 500 Forecast: SPX Continues to Drift Away from Record Highs
Recent trading sessions have done little to restore confidence in the equity market. Over the last four sessions, the S&P 500 has declined by nearly 1.00%, a move that highlights growing short-term weakness and keeps the index moving further away from its record-high territory.


RBA delivers 25bp hike, Bullock now the main event
The RBA delivered the expected 25bp hike, but Bullock’s press conference now looms as the bigger volatility risk for AUD/USD and the ASX 200.
StoneX Europe Ltd may make third party material available on this website which may contain information included but not limited to the conditions of financial markets. The material is for information purposes only and does not contain, and should not be construed as containing, investment advice and/or investment recommendation and/or an investment research and/or an offer of or solicitation for any transactions in financial instruments; any decision to enter into a specific transaction shall be made by the client following an assessment by him/her of their situation.
StoneX Europe Ltd makes no representation or warranty and assumes no liability as to the accuracy or completeness of the information provided, nor any loss arising from any investment based on a recommendation, forecast or other information supplied. You should always seek independent advice as to your suitability to speculate in any related markets and your ability to assume the associated risks, if you are at all unsure. We are not under any obligation to update any such material. Any opinion made may be personal to the author and may not reflect the opinion of StoneX Europe Ltd.