






USDJPY Unaffected by Terrible GDP
The GDP data out of Japan earlier during Asian hours was nothing short of awful.
Share this:

Yikes!!! The GDP data out of Japan earlier during Asian hours was nothing short of awful. The Annualized Preliminary GDP Growth Rate for Q4 was -6.3% vs an expectation of -3.7% and 0.5% in Q3. Granted, Japan did introduce a new sales tax AND they had a devastating typhoon. However, those were already factored into the estimate of -3.7%!!!
But USD/JPY is immune to bad data from Japan, which has been fairly weak for the past couple decades (yes, decades). So, bad data is good data. Traders know that the government will be there to provide more stimulus if need be.
On another note, in addition to the bad GDP data concerns are growing about the Coronavirus in Japan. Japan is shutting down large public events to prevent any contagion that may occur, including emperor’s birthday celebrations and the Tokyo Marathon (except to elite runners). Could this eventually feed through to GDP as it is in China???
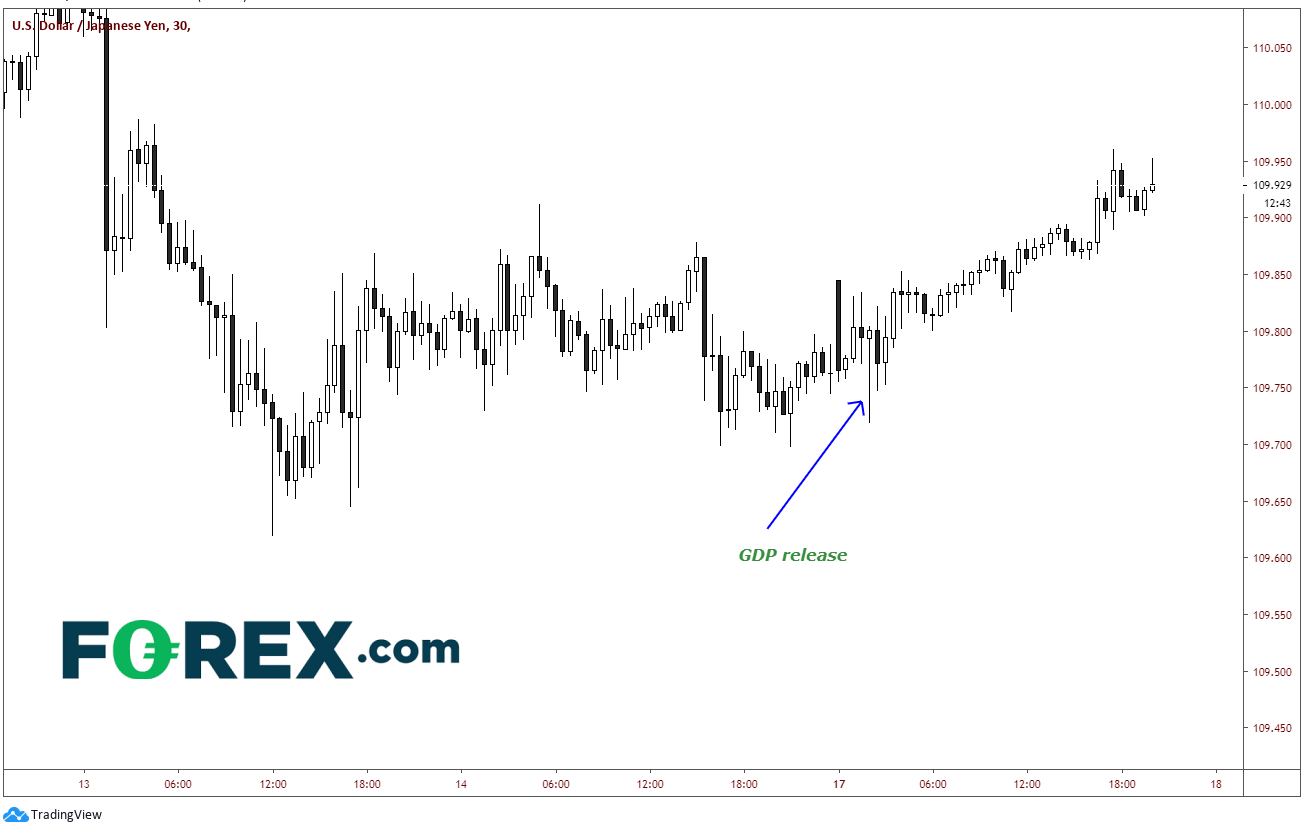
USD/JPY barely even flinched on the data. On a 30-minute chart, price traded in a tight range upon the release, moving over the next half hour between 109.82 down to 109.72 and back.
Source: Tradingview, City Index
On a weekly timeframe, USD/JPY is trading within a symmetrical triangle, near the top of the downward sloping trendline. This trendline dates back to the first week of June 2015 and is just above the 200 Week Moving Average. If the pair closes above 110.30 on a weekly basis, it has immediate room to run to near 111.50.
Source: Tradingview, City Index
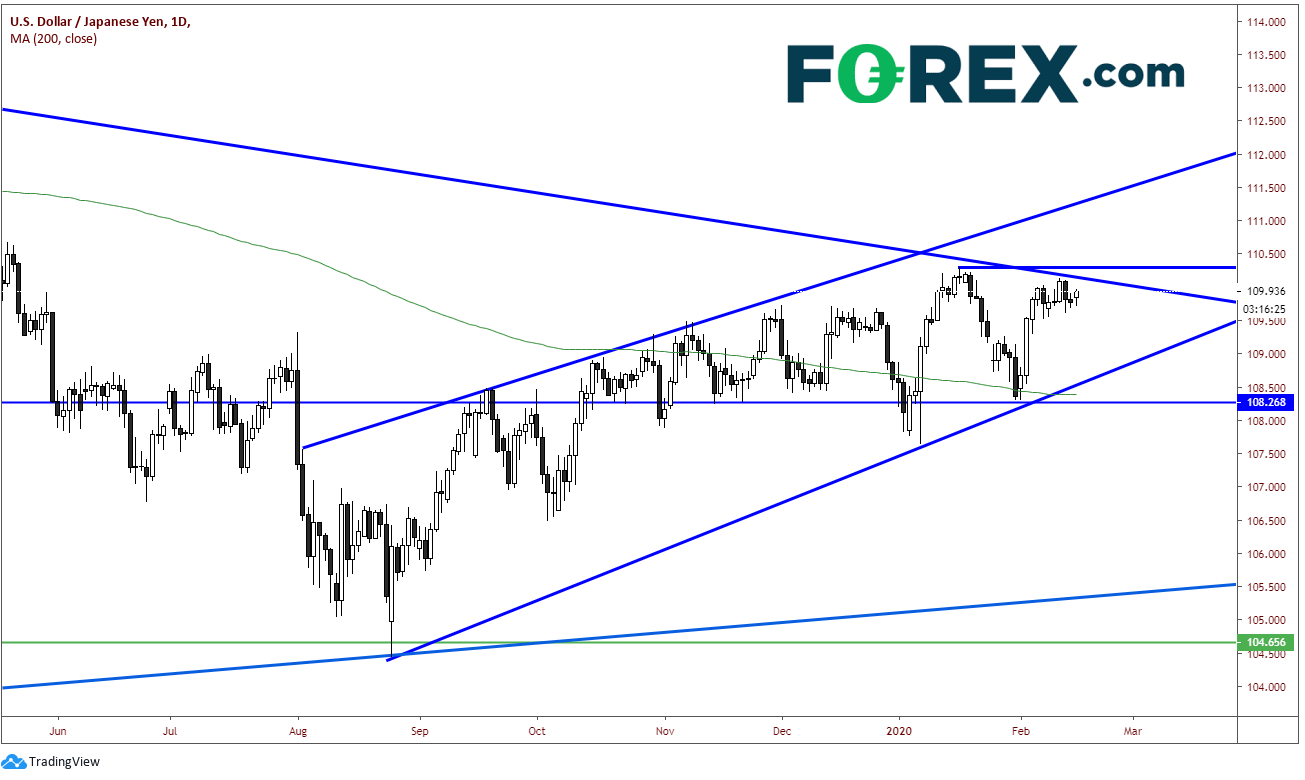
On a daily timeframe, we get a better look of how close USD/JPY is to the downward sloping long-term trendline, as well as previous highs at 110.30. There is strong support below at a confluence of supports near 108.30/50. Near this level is the upward sloping trendline from the August 23rd, 2019 lows, the 200 Day Moving Average and previous lows from February 3rd.
Source: Tradingview, City Index
As USD/JPY approaches the apex of the long-term symmetrical triangle on the weekly chart, watch for a breakout above 110.30. There will likely need to be a catalyst to get the pair moving to the upside. However, one thing that seems unlikely to be the catalyst for a move is Japan’s economic data!
Yikes!!! The GDP data out of Japan earlier during Asian hours was nothing short of awful. The Annualized Preliminary GDP Growth Rate for Q4 was -6.3% vs an expectation of -3.7% and 0.5% in Q3. Granted, Japan did introduce a new sales tax AND they had a devastating typhoon. However, those were already factored into the estimate of -3.7%!!!
But USD/JPY is immune to bad data from Japan, which has been fairly weak for the past couple decades (yes, decades). So, bad data is good data. Traders know that the government will be there to provide more stimulus if need be.
On another note, in addition to the bad GDP data concerns are growing about the Coronavirus in Japan. Japan is shutting down large public events to prevent any contagion that may occur, including emperor’s birthday celebrations and the Tokyo Marathon (except to elite runners). Could this eventually feed through to GDP as it is in China???
USD/JPY barely even flinched on the data. On a 30-minute chart, price traded in a tight range upon the release, moving over the next half hour between 109.82 down to 109.72 and back.
Source: Tradingview, FOREX.com
On a weekly timeframe, USD/JPY is trading within a symmetrical triangle, near the top of the downward sloping trendline. This trendline dates back to the first week of June 2015 and is just above the 200 Week Moving Average. If the pair closes above 110.30 on a weekly basis, it has immediate room to run to near 111.50.
Source: Tradingview, FOREX.com
On a daily timeframe, we get a better look of how close USD/JPY is to the downward sloping long-term trendline, as well as previous highs at 110.30. There is strong support below at a confluence of supports near 108.30/50. Near this level is the upward sloping trendline from the August 23rd, 2019 lows, the 200 Day Moving Average and previous lows from February 3rd.
Source: Tradingview, FOREX.com
As USD/JPY approaches the apex of the long-term symmetrical triangle on the weekly chart, watch for a breakout above 110.30. There will likely need to be a catalyst to get the pair moving to the upside. However, one thing that seems unlikely to be the catalyst for a move is Japan’s economic data!



The complete CFD trading experience
Award-winning platforms, competitive spreads, low commissions and dedicated support.
We live and breathe the markets and are dedicated to helping traders realise their ambitions as we continue to set the industry bar.
Economic calendar
Web Trader platform
Our sophisticated web-based platform is packed with features.
Related articles

EUR/USD Q4 2026 Outlook: Euro at a Crossroads as Fed, ECB Tighten 9 25 2026
EUR/USD enters Q4 at a pivotal inflection point as competing Fed-ECB policy paths and persistent inflation risks collide with major technical support.


USD/JPY Q4 2026 Outlook: Hawkish Fed Pricing Clashes With Intervention Risk
The year-end tug-of-war is clear: hawkish Fed pricing supports USD/JPY, while intervention risk limits the upside.


Japanese Yen Forecast: USD/JPY 4% Rally Challenges Post-Intervention Downtrend 9 24 2026
USD/JPY momentum has shifted sharply higher, putting a major resistance confluence in focus as U.S. and Japanese event risk builds.
StoneX Europe Ltd may make third party material available on this website which may contain information included but not limited to the conditions of financial markets. The material is for information purposes only and does not contain, and should not be construed as containing, investment advice and/or investment recommendation and/or an investment research and/or an offer of or solicitation for any transactions in financial instruments; any decision to enter into a specific transaction shall be made by the client following an assessment by him/her of their situation.
StoneX Europe Ltd makes no representation or warranty and assumes no liability as to the accuracy or completeness of the information provided, nor any loss arising from any investment based on a recommendation, forecast or other information supplied. You should always seek independent advice as to your suitability to speculate in any related markets and your ability to assume the associated risks, if you are at all unsure. We are not under any obligation to update any such material. Any opinion made may be personal to the author and may not reflect the opinion of StoneX Europe Ltd.