



Video US Equities Post Minor Gains After Reversing Earlier Losses
Whilst Wall Street only posted mild gains by Friday’s close, it is more impressive if we consider they fell over 2% at the start of the week.
Share this:
![[Video] US Equities Post Minor Gains After Reversing Earlier Losses](/-/media/Research/Global/News Analysis/Featured Image/2021/03/Charts3v2)
In today’s video we look at three US listed equities that are displaying bullish technicals. Alphabet (GOOGL) may try to re-test and breaks its highs after finding support at the trend channel. Devon Energy (DVN) and Interpublic (IPG) are two strong performers of the S&P 500 over the past 12 months, and both broke to new cycle highs last week.
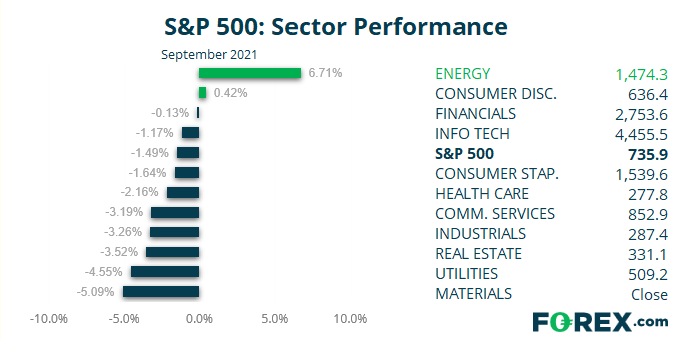
S&P 500: Market Internals
S&P 500: 4455.48 (0.15%), 24 September 2021
- Energy (0.84%) was the strongest sector and Real Estate (-1.2%) was the weakest
- 8 out of the 11 S&P 500 sectors closed higher
- 6 out of the 11 sectors outperformed the S&P 500
- 3 out of the 11 sectors traded lower on the S&P 500
- 280 (55.45%) stocks advanced and 225 (44.55%) declined
- 72.48% of stocks closed above their 200-day average
- 48.51% of stocks closed above their 50-day average
- 40.79% of stocks closed above their 20-day average
Outperformers:
- + 3.97% - Match Group Inc (MTCH.OQ)
- + 3.31% - Costco Wholesale Corp (COST.OQ)
- + 3.09% - Expedia Group Inc (EXPE.OQ)
Underperformers:
- -6.26% - Nike Inc (NKE.N)
- -5.38% - Moderna Inc (MRNA.OQ)
- -2.94% - Enphase Energy Inc (ENPH.OQ)
How to trade with FOREX.com
Follow these easy steps to start trading with FOREX.com today:
- Open a Forex.com account, or log-in if you’re already a customer.
- Search for the pair you want to trade in our award-winning platform.
- Choose your position and size, and your stop and limit levels.
- Place the trade.
Related tags:
Latest market news




The complete CFD trading experience
Award-winning platforms, competitive spreads, low commissions and dedicated support.
We live and breathe the markets and are dedicated to helping traders realise their ambitions as we continue to set the industry bar.
Economic calendar
Web Trader platform
Our sophisticated web-based platform is packed with features.
Related articles
Canadian Dollar Short-term Outlook: USD/CAD Five-Week Rally Hits a Wall at Major Resistance 10 14 2026
USD/CAD is holding near fresh yearly highs, but bearish divergence and a well-defined October range raise the stakes at major resistance.


USD/JPY forecast: hot US CPI lifts the pair above its 200-day average
Hotter-than-expected US inflation has pushed USD/JPY above its 200-day moving average, putting 160 and the risk of Bank of Japan intervention back in focus. The breakout still needs to hold, and a failure could send the pair sharply lower.


Australian Dollar Technical Outlook: AUD/USD Trend Break Faces Immediate Test 10 14 2026
AUD/USD is trying to hold a fresh trend break as renewed selling pressure tests whether the recovery can extend beyond the recent rebound.
StoneX Europe Ltd may make third party material available on this website which may contain information included but not limited to the conditions of financial markets. The material is for information purposes only and does not contain, and should not be construed as containing, investment advice and/or investment recommendation and/or an investment research and/or an offer of or solicitation for any transactions in financial instruments; any decision to enter into a specific transaction shall be made by the client following an assessment by him/her of their situation.
StoneX Europe Ltd makes no representation or warranty and assumes no liability as to the accuracy or completeness of the information provided, nor any loss arising from any investment based on a recommendation, forecast or other information supplied. You should always seek independent advice as to your suitability to speculate in any related markets and your ability to assume the associated risks, if you are at all unsure. We are not under any obligation to update any such material. Any opinion made may be personal to the author and may not reflect the opinion of StoneX Europe Ltd.