



Wall Street looks past weak economic data, PMI’s up next
More economic data points to further weakness for the US economy, it hasn’t prevented key stock market indices enjoying a countertrend bounce.
Share this:

Employment in the US is arguably the last shoe to drop before the Fed are likely to concede the economy is not as robust as it is touting. Afterall, the economy continues to add around 370k jobs each month according to the NFP report (Nonfarm payroll), even if this is around 50% lower from its post-pandemic highs. But I continue to argue that NFP is a lagging indicator, and other metrics are pointing towards a weaker NFP report in the coming months.
Jobless claims are on the rise
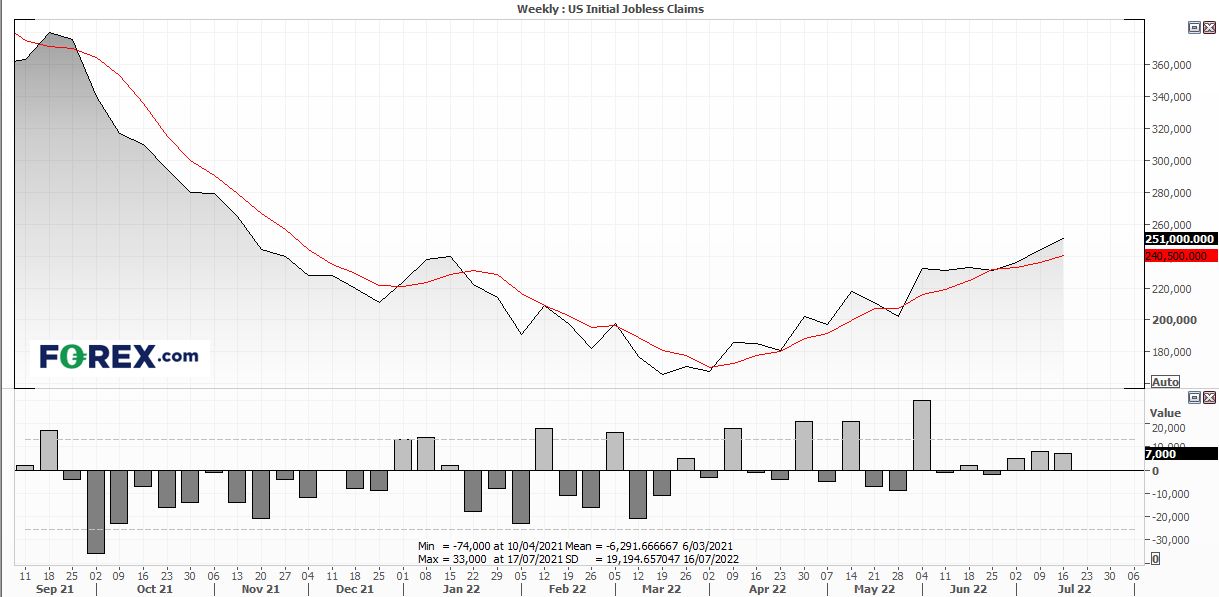
Initial jobless claims rose to a quarter of a million last week for the first time since November 2021. It’s the third consecutive weekly rise (or 4 out of 5) and has risen at a faster pace. We also note that the employment component of the Philadelphia Business Activity Index fell to its lowest level since May 2021. And as mentioned in the previous report, job openings appear to have topped and layoffs are on the rise.

Regional PMI’s soft ahead of National PMI’s
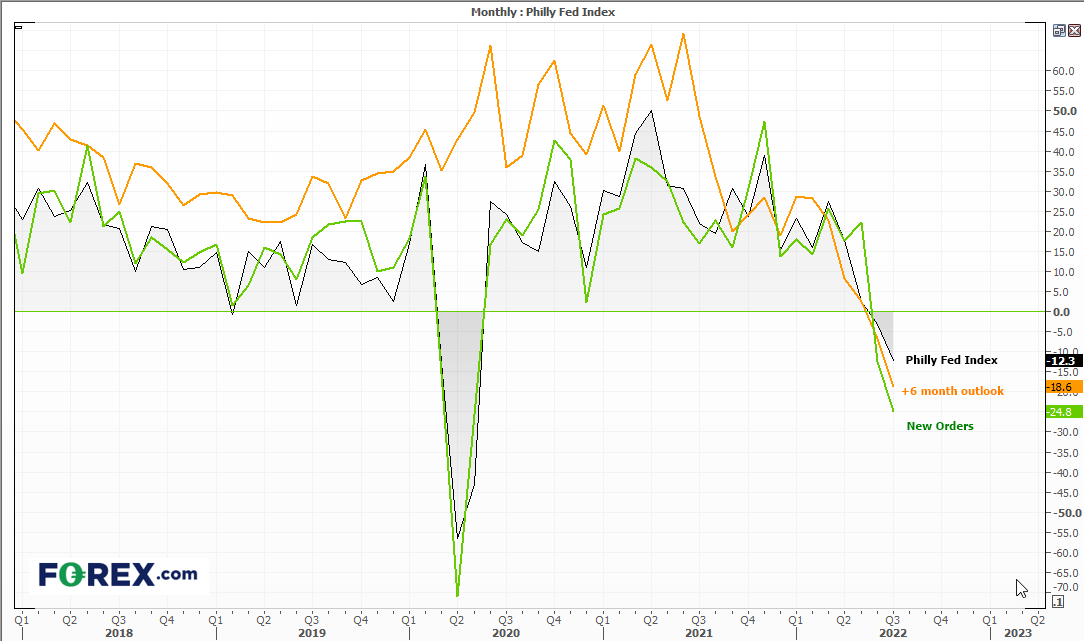
for the Philly Fed index, it also points to further weakness in general with the Business Activity index and new orders falling to a new post-pandemic low. But perhaps more worryingly, the outlook has fallen to it most dire level since 1979. Take a look at our twitter thread for a closer look at some of these charts, but overall the picture is grim ahead of today’s national PMI data.
But on a positive sidenote, prices paid have fallen to their lowest level since January 2021, which is yet another metric which points to softer inflation.

US indices look set to extend their countertrend rally
Shares markets are currently enjoying a countertrend rally, partly thanks to stronger earnings, weaker data (which anticipates fewer Fed hikes) and – let’s face it – every downtrend needs a retracement. And that leaves potential longs looking more appealing over the near-term for the Dow Jones and S&P 500.
The Dow formed a higher low last week, and since broken above a bearish trendline. Wednesday’s strong bullish candle closed above the monthly pivot and previous swing high, and yesterday formed a small bullish engulfing candle, and its low respected a prior high as support. So perhaps we’ll see this move to the 33,000 resistance zone, for which our bias remains bullish above the monthly pivot point – or yesterday’s low could be used for tighter risk management.


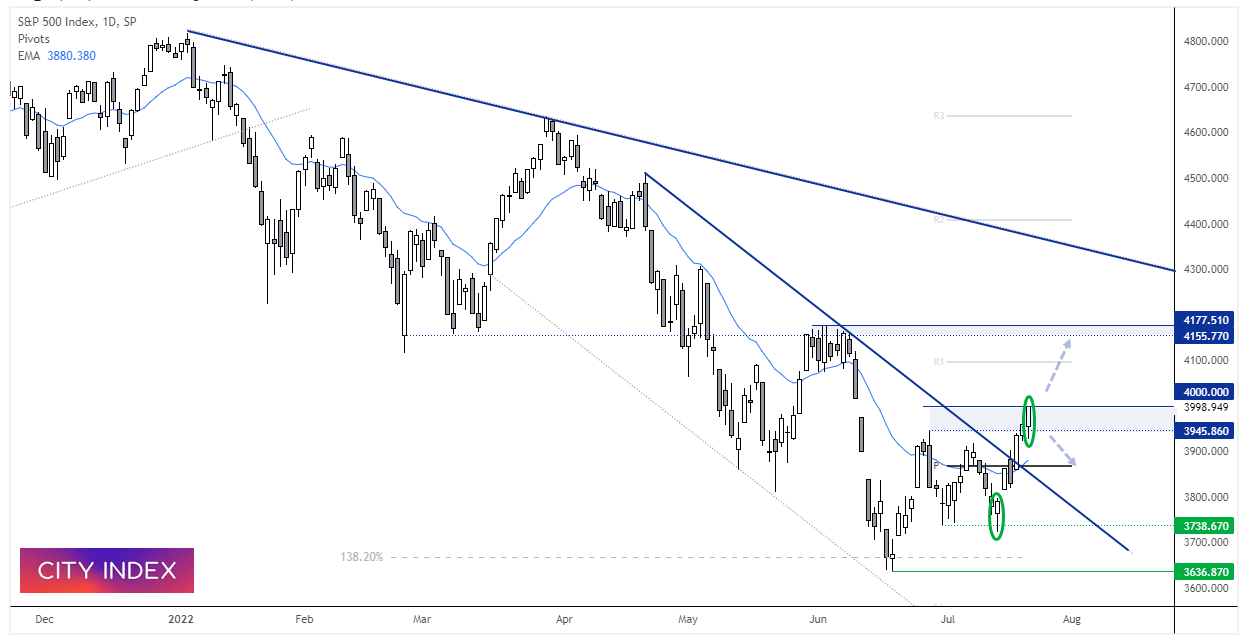
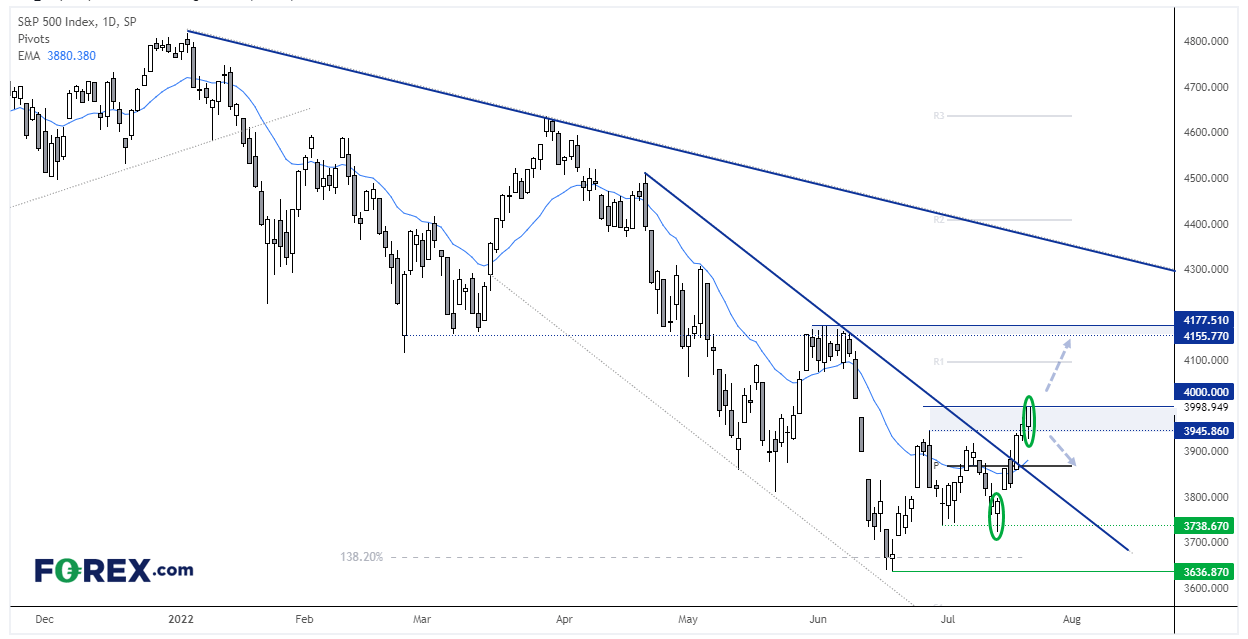
The S&P 500 made easy work of the bearish trendline mentioned earlier this week – and moved promptly to the bear’s next line of defence at 4,000. Given it closed at the high of the day of a bullish engulfing candle, just below 4,000 – with Dow also looking bullish – odds now favour a breakout here too.
Related analysis:
Related analysis:
How to trade with City Index
You can easily trade with City Index by using these four easy steps:
- Open an account, or log in if you’re already a customer
• Open an account in the UK
• Open an account in Australia
• Open an account in Singapore
- Search for the company you want to trade in our award-winning platform
- Choose your position and size, and your stop and limit levels
- Place the trade
How to trade with FOREX.com
Follow these easy steps to start trading with FOREX.com today:
- Open a Forex.com account, or log in if you’re already a customer.
- Search for the pair you want to trade in our award-winning platform.
- Choose your position and size, and your stop and limit levels.
- Place the trade.
Related tags:
Latest market news




The complete CFD trading experience
Award-winning platforms, competitive spreads, low commissions and dedicated support.
We live and breathe the markets and are dedicated to helping traders realise their ambitions as we continue to set the industry bar.
Economic calendar
Web Trader platform
Our sophisticated web-based platform is packed with features.
Related articles
Gold Q4 2026 outlook: Resilience in the face of rallying dollar and yields
As we headed towards the latter stages of Q3 and into Q4, the Fed had just hiked rates in a hawkish FOMC meeting, while the likes of the ECB and BoJ had also tightened their respective policies. Oil prices remained elevated amid the prolonged US-Iran conflict. Meanwhile, bond yields were breaking out, and the dollar was higher across the board. Yet, remarkably, gold was still holding in the positive territory for the third quarter, even if it had weakened somewhat in September.
EUR/USD Q4 2026 Outlook: Euro at a Crossroads as Fed, ECB Tighten 9 25 2026
EUR/USD enters Q4 at a pivotal inflection point as competing Fed-ECB policy paths and persistent inflation risks collide with major technical support.

USD/JPY Q4 2026 Outlook: Hawkish Fed Pricing Clashes With Intervention Risk
The year-end tug-of-war is clear: hawkish Fed pricing supports USD/JPY, while intervention risk limits the upside.

StoneX Europe Ltd may make third party material available on this website which may contain information included but not limited to the conditions of financial markets. The material is for information purposes only and does not contain, and should not be construed as containing, investment advice and/or investment recommendation and/or an investment research and/or an offer of or solicitation for any transactions in financial instruments; any decision to enter into a specific transaction shall be made by the client following an assessment by him/her of their situation.
StoneX Europe Ltd makes no representation or warranty and assumes no liability as to the accuracy or completeness of the information provided, nor any loss arising from any investment based on a recommendation, forecast or other information supplied. You should always seek independent advice as to your suitability to speculate in any related markets and your ability to assume the associated risks, if you are at all unsure. We are not under any obligation to update any such material. Any opinion made may be personal to the author and may not reflect the opinion of StoneX Europe Ltd.