








Weekly COT Report Sterling Traders Flip To Net Long
A summary of the weekly Commitment of Traders Report (COT) from CFTC to show market positioning among large speculators.
Share this:

Read our guide on how to interpret the weekly COT report
As of Tuesday 24th December 2019:
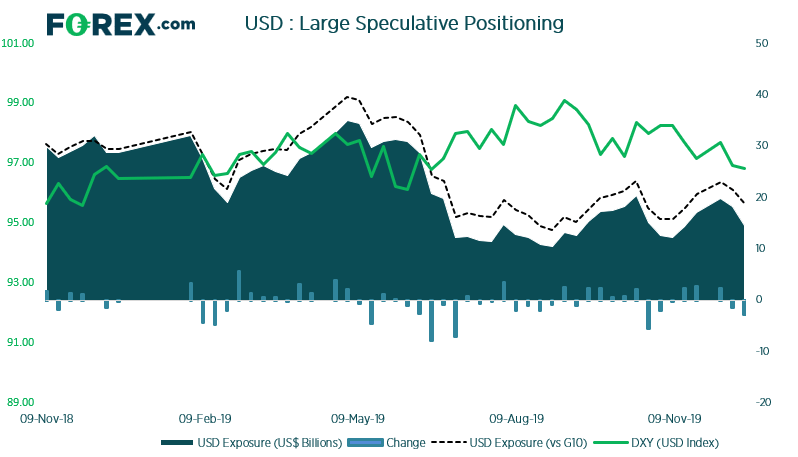
- Large speculators reduced net-long exposure to USD by -$3.6 billion and currently stand net-long by $14.5 billion.
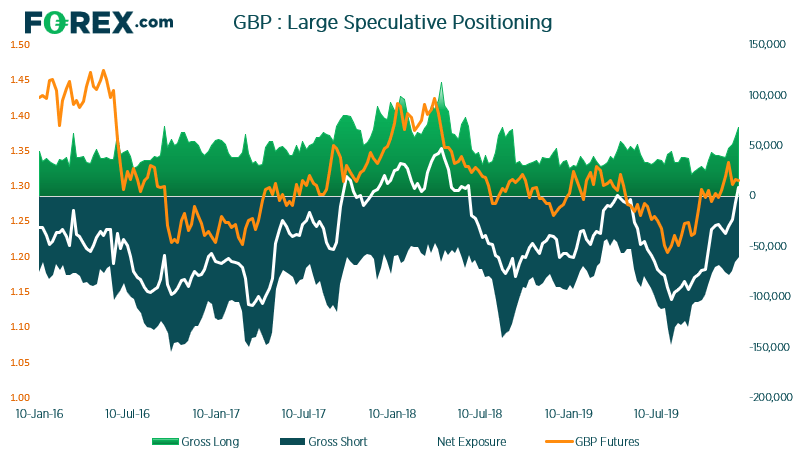
- GBP traders flipped to net-long exposure for the first time since April
- NZD traders were their least bearish in nine months
- The divergence between CAD futures pricing and positioning continued to widen
USD: Large speculators cannot seem to find the momentum to be net-long USD by over$20 billion. Net-long exposure has essentially oscillated between $10-$20 billion since July, although looking at price action its possible it could dip beneath $10 over the coming weeks.
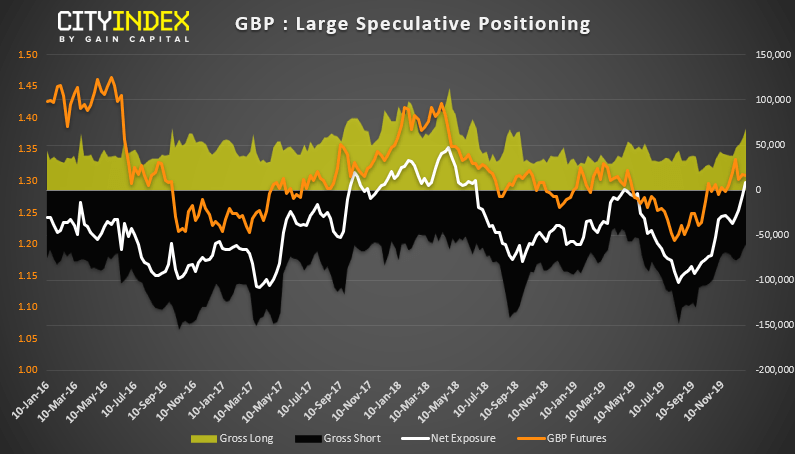
GBP: Sterling traders flipped to net-long exposure for the first time in nine months. Although perhaps worth pointing out it lasted net-long for just one week on that occasion. That said, the difference this time around is there’s a clear rise in gross shorts and closure of net shorts over recent weeks, which is much more conducive of a stronger move. Yet on the flip side, a weaker USD has helped, and the UK is about to return to the negotiating table with Eurozone members, meaning GBP will remain a politically driven currency so traders would be wise to remain nimble.
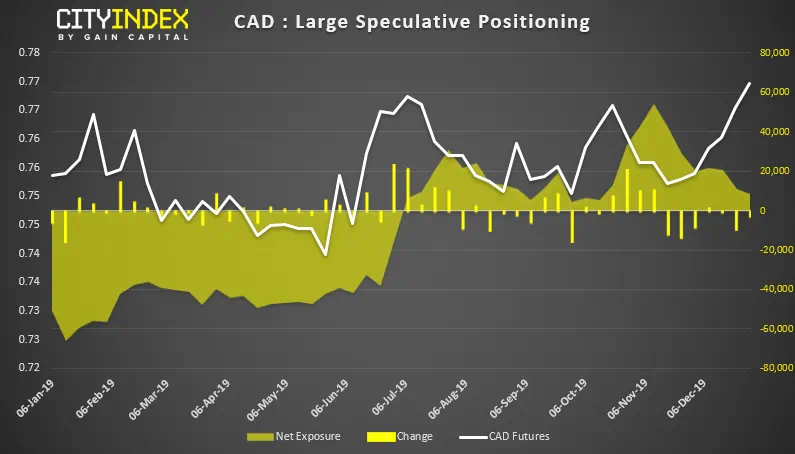
CAD: There’s a clear divergence between market prices and positioning. Whilst futures prices have risen to their highest level since Q4 2018, market positioning is barely net-long. They’ll converge at some point, but we’ll need to see if speculators are about to be caught on the wrong side of the move and fuel a more bullish rally (although higher oil prices from Middle East tensions could perhaps help there). Yet domestically, data remains weaker and it appears harder for BOC to justify rates at 1.75. So, get your popcorn out as we could be building up for a larger move, one way or other for CAD prices.
As of Tuesday 24th December 2019:
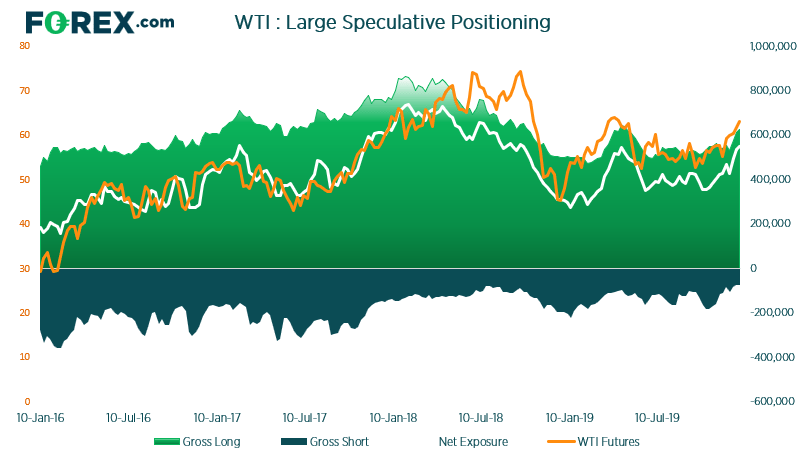
- Net-long exposure on WTI is its most bullish since September 2018
- Bullish exposure on platinum hit a fresh record high
- Copper traders were their most bullish in nine months
- Gold positioning was again little changed (but this is clearly out of date given the bullish moves unfold this past week)
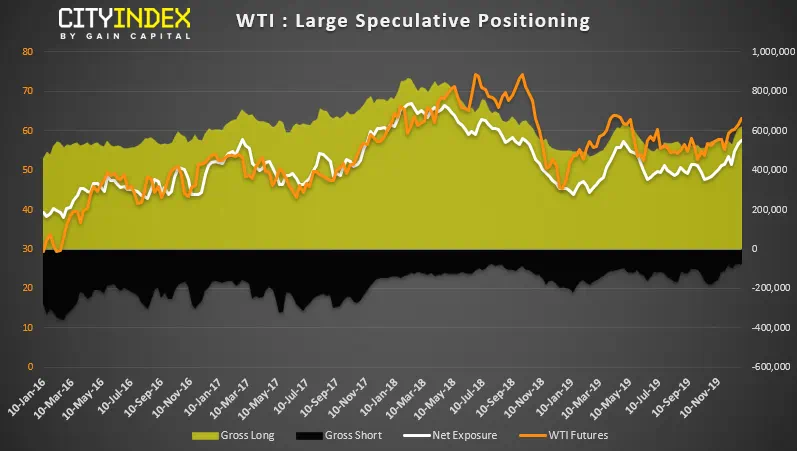
WTI: Net-log exposure on WTI is its most bullish since September 2018. And that was before tensions flared in the Middle East. It’s worth noting that gross longs have risen whilst gross shorts have been culled, which is what we require for a healthy breakout. Add into the mix the US attacking pro-Iranian personnel and we have the recipe for a breakout. Interesting, it is rising oil prices which has been lacking from the bearish case for a recession. Time will tell if this will break the camel’s back, but for now, oil prices are firming up and positioning has been building a case for a breakout.
Read our guide on how to interpret the weekly COT report
As of Tuesday 24th December 2019:
- Large speculators reduced net-long exposure to USD by -$3.6 billion and currently stand net-long by $14.5 billion.
- GBP traders flipped to net-long exposure for the first time since April
- NZD traders were their least bearish in nine months
- The divergence between CAD futures pricing and positioning continued to widen
USD: Large speculators cannot seem to find the momentum to be net-long USD by over$20 billion. Net-long exposure has essentially oscillated between $10-$20 billion since July, although looking at price action its possible it could dip beneath $10 over the coming weeks.
GBP: Sterling traders flipped to net-long exposure for the first time in nine months. Although perhaps worth pointing out it lasted net-long for just one week on that occasion. That said, the difference this time around is there’s a clear rise in gross shorts and closure of net shorts over recent weeks, which is much more conducive of a stronger move. Yet on the flip side, a weaker USD has helped, and the UK is about to return to the negotiating table with Eurozone members, meaning GBP will remain a politically driven currency so traders would be wise to remain nimble.
CAD: There’s a clear divergence between market prices and positioning. Whilst futures prices have risen to their highest level since Q4 2018, market positioning is barely net-long. They’ll converge at some point, but we’ll need to see if speculators are about to be caught on the wrong side of the move and fuel a more bullish rally (although higher oil prices from Middle East tensions could perhaps help there). Yet domestically, data remains weaker and it appears harder for BOC to justify rates at 1.75. So, get your popcorn out as we could be building up for a larger move, one way or other for CAD prices.
As of Tuesday 24th December 2019:
- Net-long exposure on WTI is its most bullish since September 2018
- Bullish exposure on platinum hit a fresh record high
- Copper traders were their most bullish in nine months
- Gold positioning was again little changed (but this is clearly out of date given the bullish moves unfold this past week)
WTI: Net-log exposure on WTI is its most bullish since September 2018. And that was before tensions flared in the Middle East. It’s worth noting that gross longs have risen whilst gross shorts have been culled, which is what we require for a healthy breakout. Add into the mix the US attacking pro-Iranian personnel and we have the recipe for a breakout. Interesting, it is rising oil prices which has been lacking from the bearish case for a recession. Time will tell if this will break the camel’s back, but for now, oil prices are firming up and positioning has been building a case for a breakout.
Latest market news




The complete CFD trading experience
Award-winning platforms, competitive spreads, low commissions and dedicated support.
We live and breathe the markets and are dedicated to helping traders realise their ambitions as we continue to set the industry bar.
Economic calendar
Web Trader platform
Our sophisticated web-based platform is packed with features.
Related articles
EUR/USD weekly outlook: Oil, inflation and NFP in focus
After coming under significant pressure in recent weeks, the EUR/USD came off its lows to finish the week on a positive note on Friday, albeit with only a mild rebound. That was not enough to prevent the exchange rate falling for the third consecutive week, as the US dollar and bond yields rallied across the board.

Gold Price Forecast: XAU/USD Avoids Breakdown as Yields Surged but Can it Continue?
Surging Treasury yields sent a jolt across markets last week but, so far, gold prices have held above the FOMC low. The big question now is whether that can continue and, if not, will bulls show up at $4100 or $4k like they did in June and July?

Gold Q4 2026 outlook: Resilience in the face of rallying dollar and yields
As we headed towards the latter stages of Q3 and into Q4, the Fed had just hiked rates in a hawkish FOMC meeting, while the likes of the ECB and BoJ had also tightened their respective policies. Oil prices remained elevated amid the prolonged US-Iran conflict. Meanwhile, bond yields were breaking out, and the dollar was higher across the board. Yet, remarkably, gold was still holding in the positive territory for the third quarter, even if it had weakened somewhat in September.
StoneX Europe Ltd may make third party material available on this website which may contain information included but not limited to the conditions of financial markets. The material is for information purposes only and does not contain, and should not be construed as containing, investment advice and/or investment recommendation and/or an investment research and/or an offer of or solicitation for any transactions in financial instruments; any decision to enter into a specific transaction shall be made by the client following an assessment by him/her of their situation.
StoneX Europe Ltd makes no representation or warranty and assumes no liability as to the accuracy or completeness of the information provided, nor any loss arising from any investment based on a recommendation, forecast or other information supplied. You should always seek independent advice as to your suitability to speculate in any related markets and your ability to assume the associated risks, if you are at all unsure. We are not under any obligation to update any such material. Any opinion made may be personal to the author and may not reflect the opinion of StoneX Europe Ltd.