



HSBC FY preview: Where next for the HSBC share price?
HSBC shares have outperformed its more UK-focused rivals since the start of the year, but how will they perform after its next set of earnings?
Share this:

When will HSBC release annual earnings?
HSBC will report fourth quarter and full year earnings on the morning of Tuesday February 22. As the bank is also listed in Hong Kong, it will publish them earlier than most UK stocks at 0400 GMT with a conference call to follow at 0830 GMT.
HSBC FY earnings preview
NatWest kicked-off the earnings season for the Big Four London-listed banks this week by revealing it generated bumper profits of £4 billion in 2021 after suffering a £351 million loss the year before, allowing it to grow dividends, launch a new buyback and set a buoyant tone for next week, with Barclays reporting results on Wednesday and Lloyds Banking Group publishing earnings on Thursday.
HSBC stands out from its three rivals, particularly NatWest and Lloyds that are both firmly geared toward the UK economy, because it has greater exposure to Asia. Notably, HSBC and the fifth London-listed bank that is also primarily operating in Asia, Standard Chartered, have outperformed those geared more toward the UK economy since the start of 2022:
| Share Price Movements | YTD | 1 Year | 2 Years |
| HSBC | 15.8% | 30.3% | -2.9% |
| Barclays | -1.8% | 30.9% | 7.4% |
| Lloyds | 4.3% | 38.9% | -6.0% |
| NatWest | 4.5% | 30.9% | -13.2% |
| Standard Chartered | 24.0% | 17.2% | -8.6% |
Notably, Standard Chartered shares have risen almost 5% since the bank released its fourth quarter earnings this week despite income and earnings coming in below expectations. That was because its net interest margin, the key measure of profitability in the banking industry, was higher than expected (albeit still down from 2020) to alleviate fears that costs could spiral out of control and because the bank sweetened shareholders with a new buyback and dividend, coupled with an acceleration in returns going forward as confidence grows thanks to higher interest rates on the horizon.
A similar theme is expected to play out for HSBC. Profits are set to broadly double year-on-year in both the fourth quarter and the full year. Below is a table outlining what analysts expect when it comes to some of HSBC’s core metrics for both the fourth quarter and the full year:
| (Billions) | Q4 2020 | Q4 2021E | FY 2020 | FY 2021E |
| Reported Revenue | $11.8 | $12.0 | $50.4 | $50.1 |
| Net Interest Margin | 1.22% | 1.19% | 1.32% | 1.20% |
| Reported Pretax Profit | $1.4 | $3.0 | $8.8 | $19.4 |
HSBC said the revenue outlook was ‘becoming more positive’ when it released third quarter earnings and said this should continue going forward as loan demand picks up and interest rates rise. Low interest rates and the uncertainty lingering over the economy in 2021 means topline income will be down in 2021, but analysts believe this can grow by over 5% in 2022.
HSBC is expected to follow its peers by continuing to unwind the large sums put aside to cover loans that could have potentially gone sour during the pandemic as the global economy bounces back. Analysts are expecting HSBC to see a net boost from Expected Credit Losses (ECL) of $123 million in the fourth quarter compared to the hefty $1.2 billion drag that was seen the year before. For the full year, HSBC is expected to benefit from a net release of almost $1.5 billion compared to the $8.8 billion provision made in 2020.
The net interest margin is being closely-watched and will contract this year like it has at other banks as low interest rates squeeze profitability, but analysts are currently expecting HSBC to grow its margin to 1.25% in 2022 on expectations that it will be able to keep costs broadly flat and grow topline income thanks to higher loan demand and rates.
Investors will want to see HSBC reiterate its commitment to deliver a return on tangible equity of at least 10% over the medium-term (from 9.1% on an annualised rate in Q3) to demonstrate it can keep a cap on rising costs amid rising inflation and increased investment. It is aiming to get its CET 1 ratio – which measures the financial strength of a bank – to more normal levels of 14.0% to 14.5% before the end of 2022, fuelled by a combination of growth and capital returns. The CET 1 ratio stood at 15.9% at the end of September. HSBC launched a $2 billion buyback shortly after its last set of results and any further buybacks would be welcomed by the markets.
Where next for the HSBC share price?
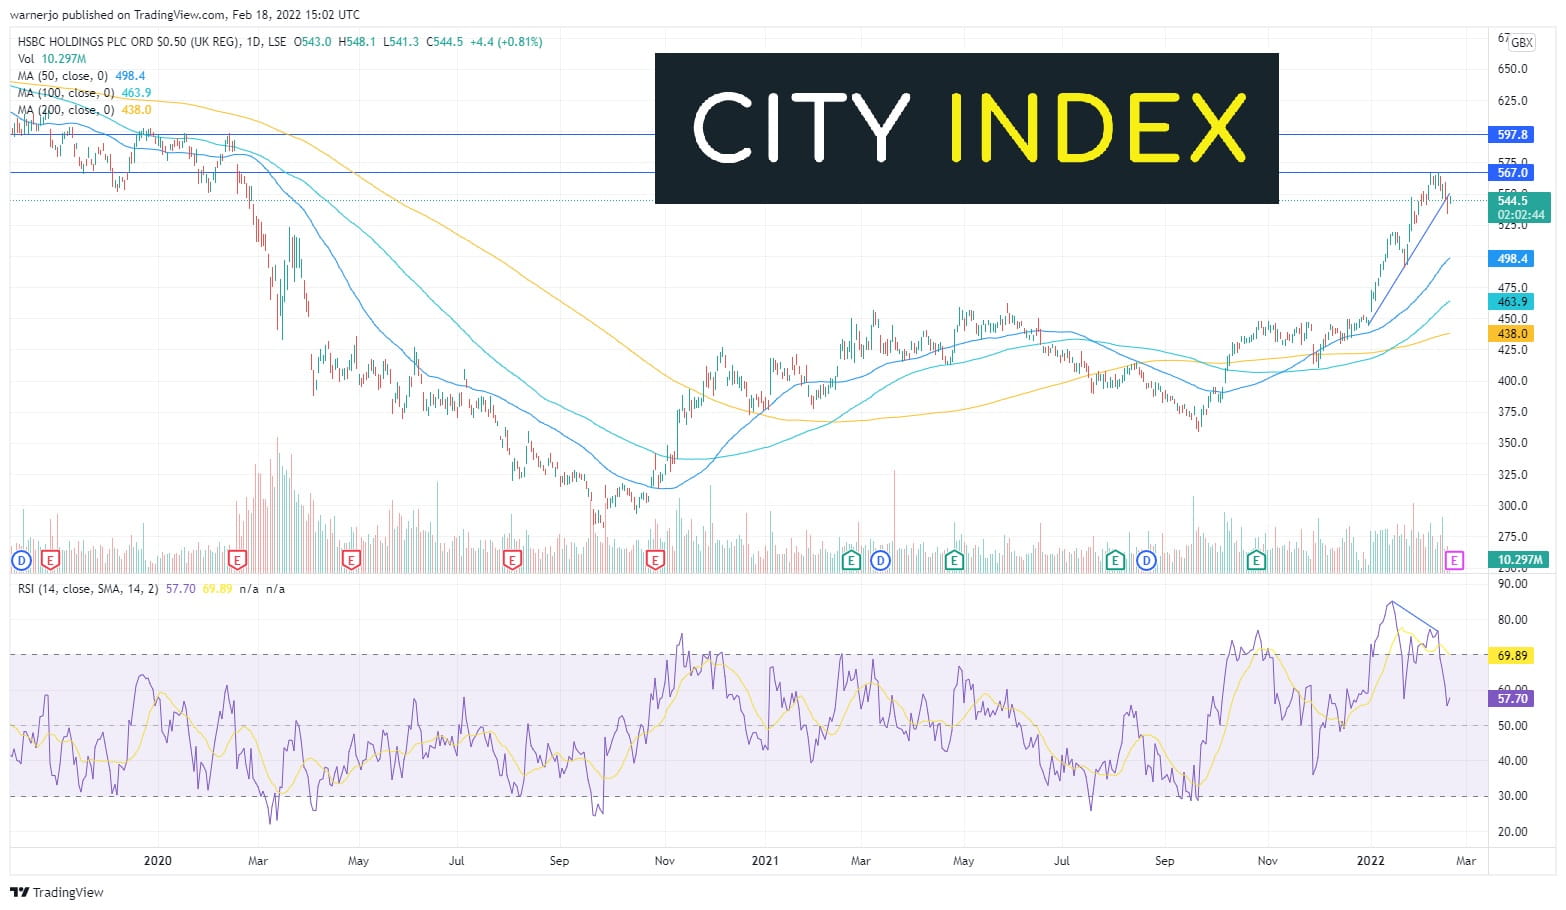
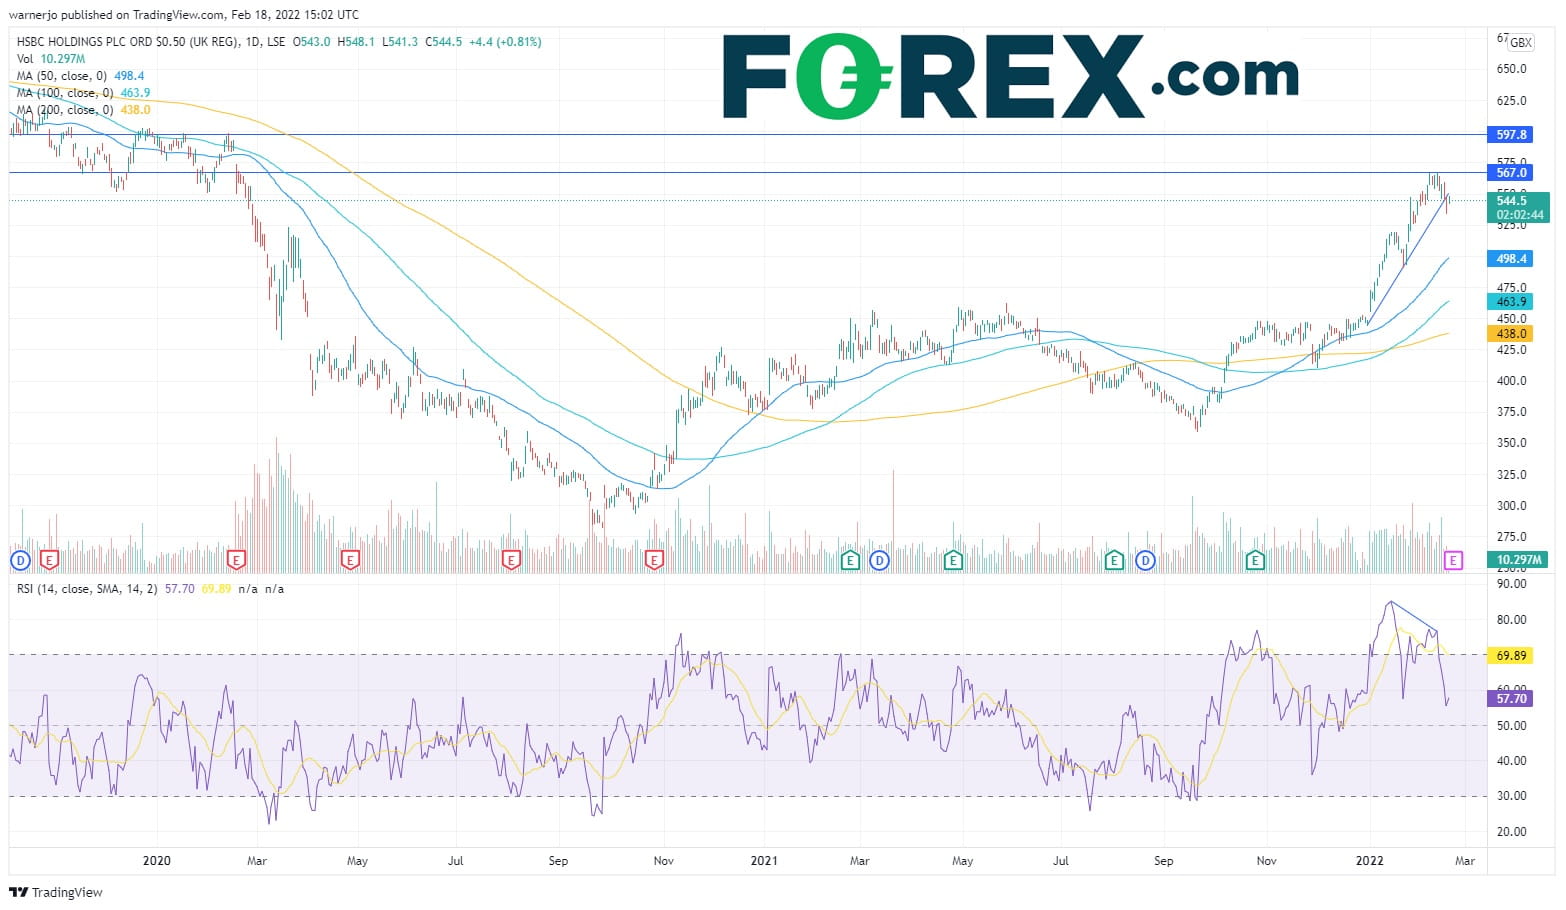
The latest uptrend in HSBC shares began at the start of 2022, with buyers managing to push the stock to its highest level since the start of the pandemic at 567p before hitting resistance.
The stock has now broken out of the uptrend, signalling that it could be reversing. We have seen divergence from the RSI, with the stock managing to climb higher despite the indicator falling lower to present a bearish signal. If the stock remains under pressure, it could fall to the 50-day sma at 498p, which was also a level of support seen when the stock took a breather last month. Below there, the door opens to the 100-day sma at 463p and then the 200-day sma at 438p.
On the flip side, the RSI remains in bullish territory and the moving averages are climbing higher but the stock will need to break through the 567p ceiling before providing enough confidence it can head higher. This would be significant as the next key level is 598p before it can target above 600p.
How to trade HSBC shares
You can trade HSBC shares with City Index in just four easy steps:
- Open a City Index account, or log-in if you’re already a customer.
- Search for ‘HSBC’ in our award-winning platform
- Choose your position and size, and your stop and limit levels
- Place the trade
Or you can try out your trading strategy risk-free by signing up for our Demo Trading Account.
You can trade HSBC shares with Forex.com in just four steps:
- Open a Forex.com account, or log-in if you’re already a customer.
- Search for ‘HSBC’ in our award-winning platform
- Choose your position and size, and your stop and limit levels
- Place the trade
Or you can try out your trading strategy risk-free by signing up for our Demo Account.
Latest market news




The complete CFD trading experience
Award-winning platforms, competitive spreads, low commissions and dedicated support.
We live and breathe the markets and are dedicated to helping traders realise their ambitions as we continue to set the industry bar.
Economic calendar
Web Trader platform
Our sophisticated web-based platform is packed with features.
Related articles
Australian Dollar Short-term Outlook: AUD/USD 3% Plunge Puts Multi-Month Range at Risk 11 6 2026
A sharp equity-led selloff has driven AUD/USD toward critical June-low support, with strong NFP data adding pressure ahead of next week’s U.S. CPI.

Nasdaq 100 forecast: Tech stocks rebound but AI concerns linger
The Nasdaq 100 rebound has run into former support as fears over AI regulation and spending linger. Fawad Razaqzada explains why he maintains a cautious forecast and where the key levels sit.

Dollar forecast: NFP provides dollar, already supported amid tech sell-off, additional boost
The US dollar has found some mild amid the tech rout in recent days, most visibly against risk sensitive and commodity dollars. Today, we have so far seen a bit of a recovery in global indices from their overnight lows. Investors will be watching the markets to see whether fresh losses will be on the again once Wall Street gets going. Ahead of that, we have just seen the release of the October US non-farm payrolls report – and it was much stronger at 165K than expected.
StoneX Europe Ltd may make third party material available on this website which may contain information included but not limited to the conditions of financial markets. The material is for information purposes only and does not contain, and should not be construed as containing, investment advice and/or investment recommendation and/or an investment research and/or an offer of or solicitation for any transactions in financial instruments; any decision to enter into a specific transaction shall be made by the client following an assessment by him/her of their situation.
StoneX Europe Ltd makes no representation or warranty and assumes no liability as to the accuracy or completeness of the information provided, nor any loss arising from any investment based on a recommendation, forecast or other information supplied. You should always seek independent advice as to your suitability to speculate in any related markets and your ability to assume the associated risks, if you are at all unsure. We are not under any obligation to update any such material. Any opinion made may be personal to the author and may not reflect the opinion of StoneX Europe Ltd.