
- AUD/USD maintains strong relationships with global cyclical equities
- VIX futures influential in recent Aussie price action
- AUD/JPY tracking Australian–Japanese yield spreads more closely
- Contrasting technical formations put both crosses on breakout watch
The Australian dollar finds itself trading within two technical structures that could have very different implications against the US dollar and Japanese yen, putting both pairs on the watch list for potential breakouts in the short to medium term.
While risk appetite appears to be exerting greater influence on AUD/USD, relative yields have seemingly become more influential for AUD/JPY. However, there are important considerations for both pairs that traders should be aware of before contemplating potential setups.
AUD/USD and AUD/JPY: Different drivers at work
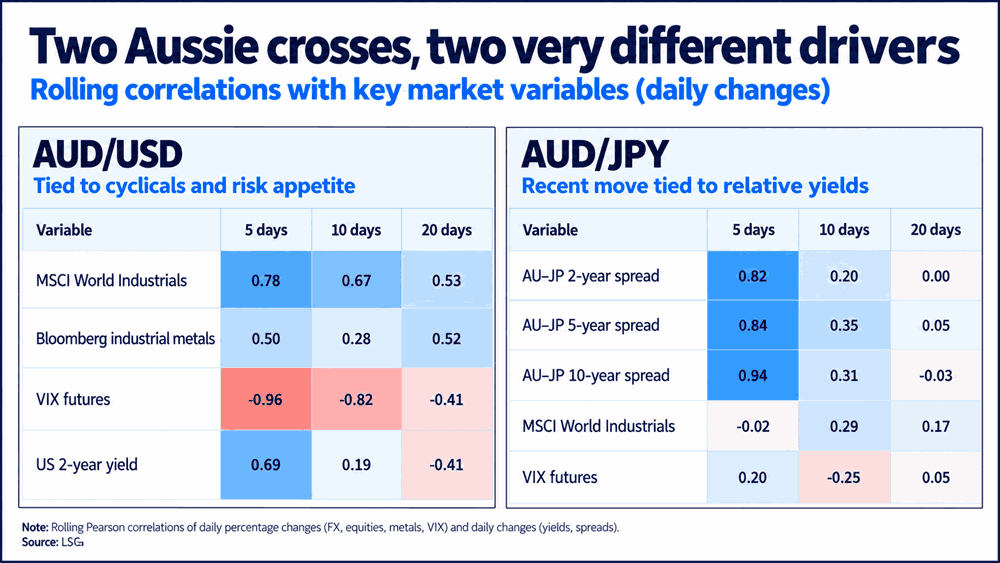
Before looking at the technical picture for both pairs, it's noticeable that AUD/JPY, which has long been regarded as a risk proxy, has more recently been behaving like a relative yields play, with AUD/USD seemingly more closely tied to risk appetite, particularly in cyclical assets.
Source: LSEG
You can see that in the correlation matrix above, with a positive and strengthening relationship between AUD/USD and industrial equities, reinforced by the very strong inverse correlation with VIX futures. There's also evidence of linkages with industrial metals, although we haven't seen the consistent strengthening witnessed against industrial equities.
Even though a degree of caution is required given the relatively short time frames, the evidence suggests risk appetite, more than yields, likely explains much of the Aussie's struggles recently.
However, when it comes to AUD/JPY, the matrix shows strong positive relationships with Australian–Japanese yield spreads across the two-year, five-year and 10-year tenors, whereas there is no meaningful relationship with cyclical assets.
Again, it's a very short window, so the message needs to be treated with a degree of caution. But more recently, relative yield movements may have been more influential on the pair.
AUD/USD: Another bearish continuation pattern emerging?
Source: TradingView
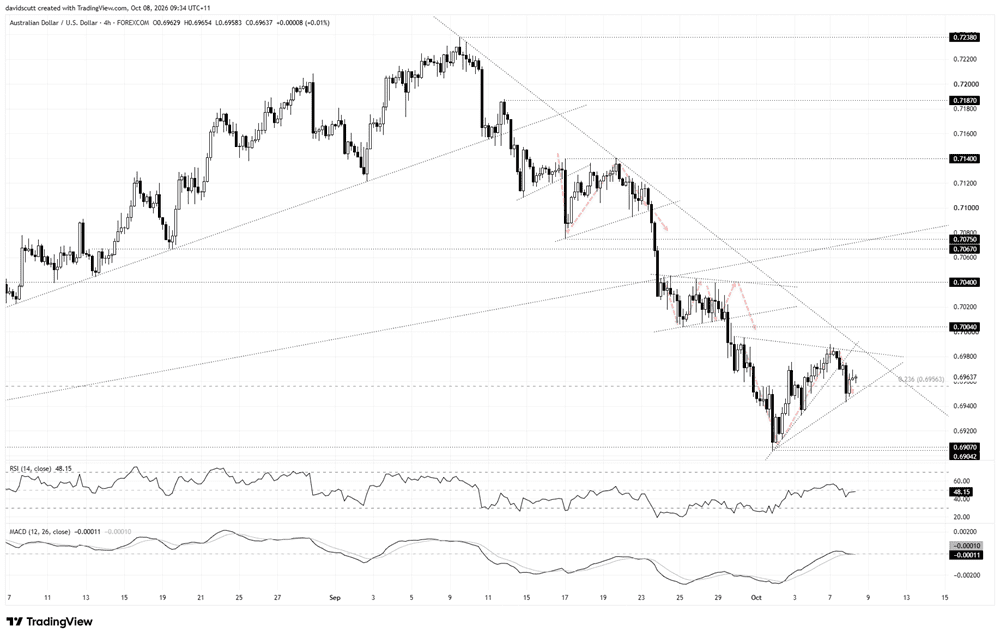
AUD/USD has been in a pronounced downtrend since the high set on September 9. Within that broader trend, we've seen a number of consolidation phases that have eventually broken down, with the pair's performance often aligned with the technical patterns it was trading in.
The latest is a structure resembling a triangle on the four-hourly chart, although the limited number of touches on either side, particularly along the rising support line, still provides reason for caution.
A level of note near where the price currently trades is the 23.6% Fibonacci retracement of the move from the Liberation Day low in April 2025 to the May 2026 high. While the price continues to trade around this level, it's arguably more of a reference point than one that could be used for trade construction.
Given the direction of travel into the structure, should it play out as convention would suggest, traders should be alert to the risk of a downside break, potentially putting a retest of the October 1 low of 0.6907 into play, where the structure initially formed.
Beyond there, levels of note on the downside include the 0.6860–0.6865 support zone, reflecting two nearby swing lows, followed by 0.6835, another low established earlier this year.
The message from the oscillators is broadly neutral, with RSI (14) sitting just beneath the 50 level, while MACD is running parallel to the signal line, both just in negative territory. That places greater emphasis on the price action in the near term.
However, it's clear from the path of travel over the past month that selling into rallies remains the preferred play unless we see a sustained break of the downtrend.
Should the triangle be broken on the topside, accompanied by a break of the September downtrend, it would weaken the case for short setups, putting levels such as 0.7004 and 0.7040 into play.
AUD/JPY: Potential falling wedge takes shape
Source: TradingView
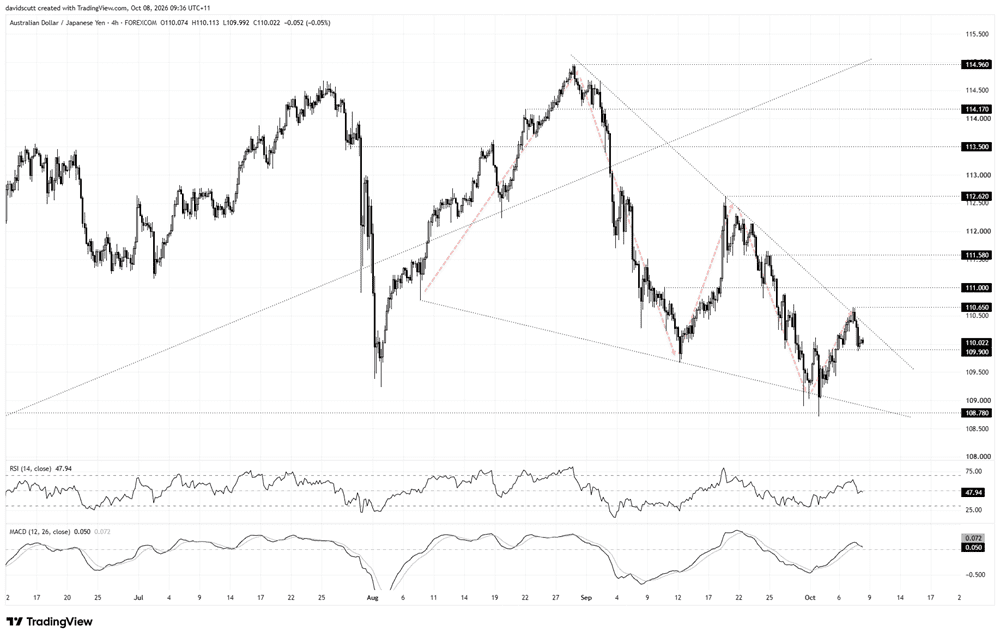
AUD/JPY is beginning to coil in what resembles a falling wedge on the four-hourly chart. While not shown, the structure has formed following the powerful rally from the lows set during the Liberation Day rout in April 2025, strengthening the case for a potential topside breakout given its characteristics as a bullish continuation pattern.
Right now, the price finds itself towards the upper side of the structure, having pulled back following a false break on Wednesday.
109.90 is a reference point just beneath where the price currently trades, having acted as both resistance and support over recent days. While only a minor level, it looms as one that could be used for setup construction by traders unwilling to wait for a potential breakout of the broader structure.
Should we see a sustained push through descending resistance extending from the highs set in early September, 110.65 is the first level of note, marking the high set earlier this week. Beyond that, 111.00, 111.58 and 112.62 are the next topside levels to watch.
Below 109.90, the lower boundary of the structure is currently found around 108.90, although the price also spent some time trading either side of 109.50 earlier this week, putting that level on the radar.
The lower boundary is also close to 108.78, a swing low set on April 1 this year from which a savage rally ensued, making the 108.78–108.90 region a support zone of note in the near term.
The message from the oscillators is again neutral, placing greater emphasis on the price action, particularly with very little on the macro calendar over the remainder of the week.
As such, risk appetite and sentiment, including developments in crude prices and their influence on global bond yields, loom as the fundamental factors to watch in the days ahead.