
WTI crude oil futures (CL) are pressing into key support near $62, even as CFTC positioning data shows traders building net-long exposure to six-month highs. While daily price action warns of a near-term correction, the broader futures backdrop suggests any pullbacks may prove limited unless $60 breaks decisively.
View related analysis:
- Nasdaq 100 Leads Risk-Off as Tech Earnings Weigh, Gold Slides
- Gold Outlook: Dead Cat Bounce Risk Builds Near Highs
- Silver Outlook: Volatility Tests Bulls in Early 2026
- Gold and Silver Outlook: Whipsaws Persist, Bulls Look for a Bounce
WTI Crude Oil Tests $62 as Futures Positioning Turns Constructive
COT Report: Net-Long Exposure Climbs to Six-Month Highs
The bullish picture for WTI crude oil continued to build last week, with futures traders increasing their net-long exposure to six-month highs. Specifically, large speculators were net-long 121.9k contracts and asset managers 76.8k contracts. In both cases, gross longs rose sharply while gross shorts were trimmed, with neither group showing signs of a sentiment extreme. This suggests crude oil prices could remain broadly supported in the coming weeks, and that pullbacks may be limited.
However, near-term risks of a pullback are emerging. An inside week formed last week, and current price action is hinting at a bearish pin bar with a lower high.
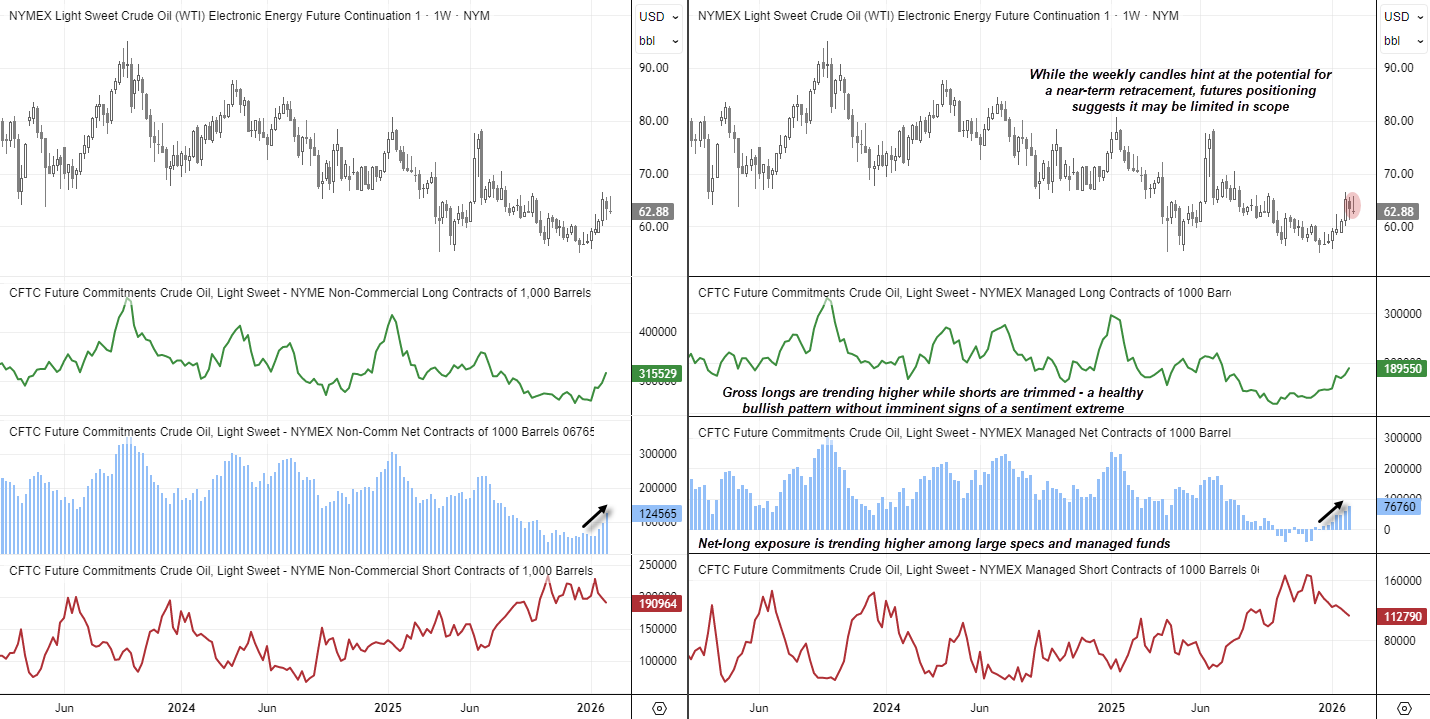
Source: CFTC, NYMEX, LSEG

WTI Crude Oil Futures (CL) Technical Analysis
The daily chart shows the December–January rally stalled near the September high. A lower high formed on Wednesday with a shooting star candle, followed by a bearish daily close beneath trend support on Thursday, signalling fading upside momentum.
It appears a three-wave correction may be unfolding against the rally from $54.70. There is a cluster of prior highs around $62.88 which could act as near-term support. A sustained break below $62 would expose the $60 handle, sitting just above the January VPOC. Take note of the 200-day averages around 60.70.
With support close by, bears may prefer to wait for a decisive break beneath $62.50 before pressing shorts, or alternatively fade rallies on rebounds. However, targeting $54 at this stage appears premature unless $60 gives way convincingly.
That said, given the constructive futures positioning backdrop, the broader bias still favours an eventual move back towards the July high. A clean break above that level would bring $70 into focus for bulls.
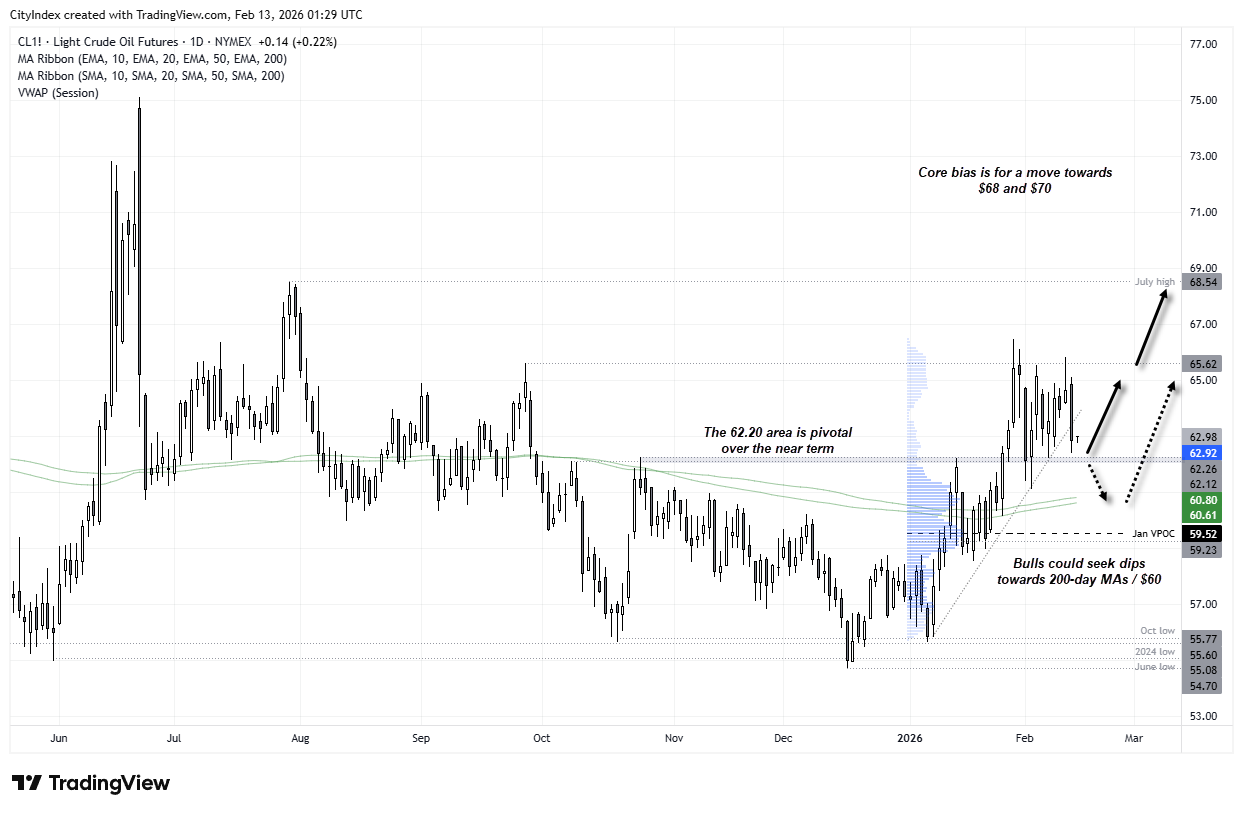
Source: CFTC, NYMEX, LSEG
View the full economic calendar
-- Written by Matt Simpson
Follow Matt on Twitter @cLeverEdge